I've been trying to do a couple of things lately--
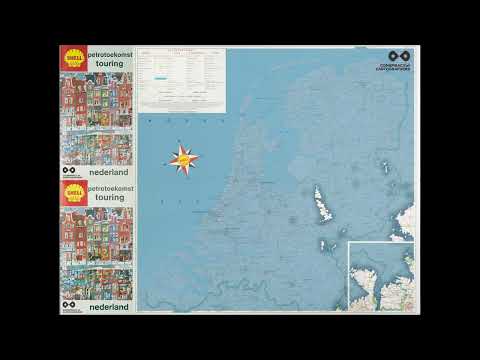
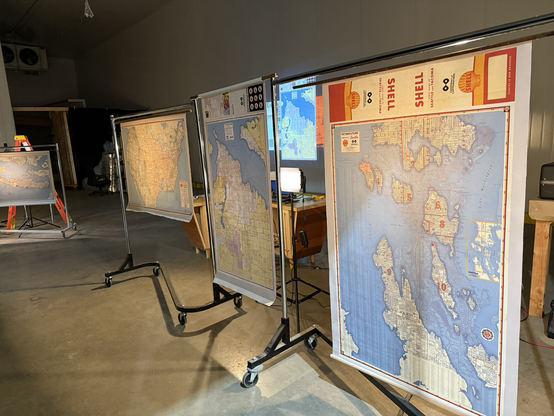
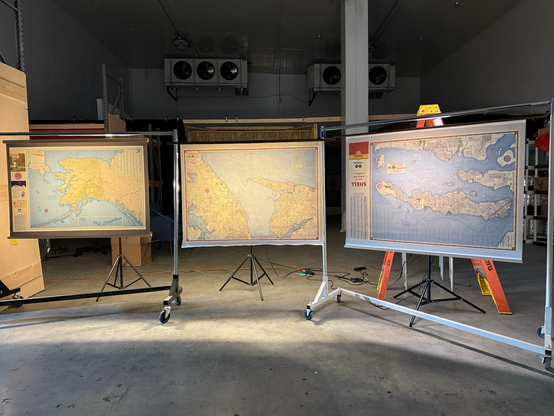
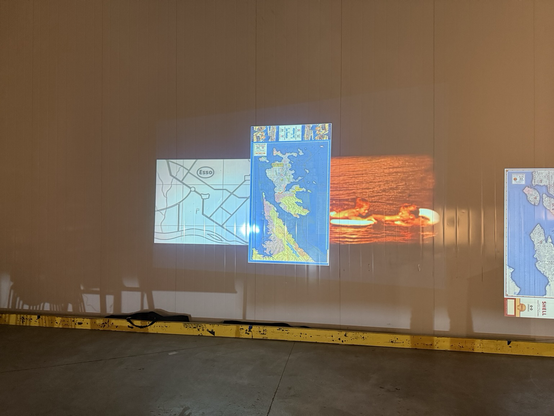
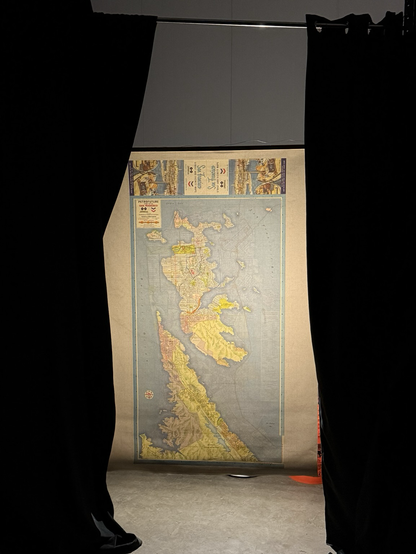
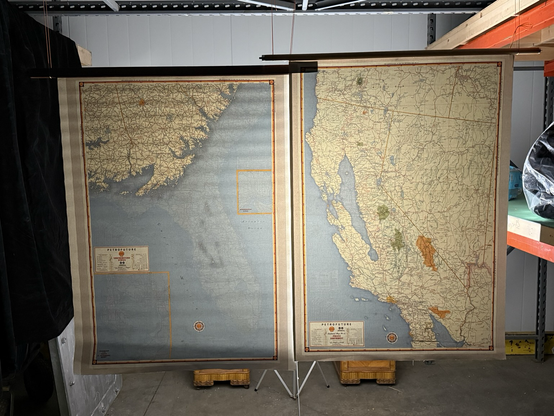
1--Make animated before/after images of the #Petrofuture maps, and 2--post more on my website.
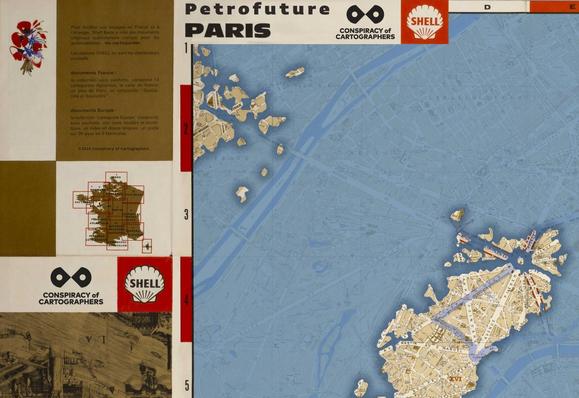
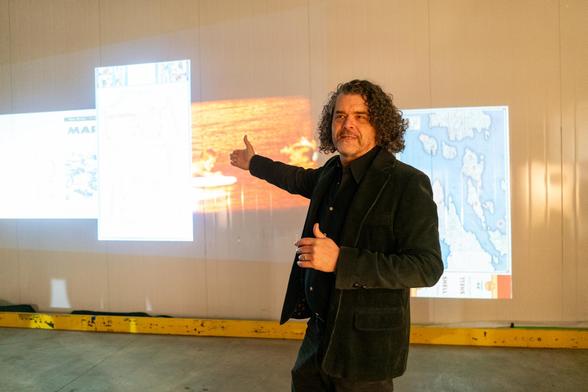
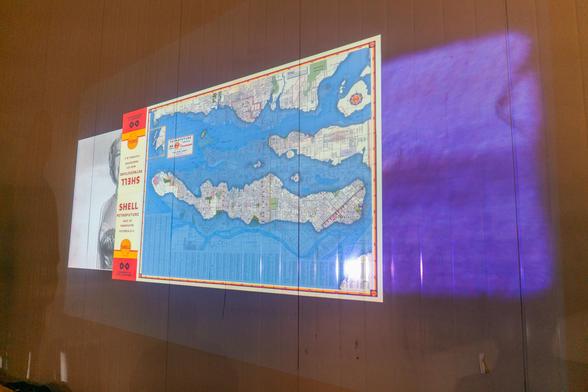
Here they are, working together! The Petrofuture of Paris
https://conspiracyofcartographers.com/2026/05/animated-petrofuture-paris/