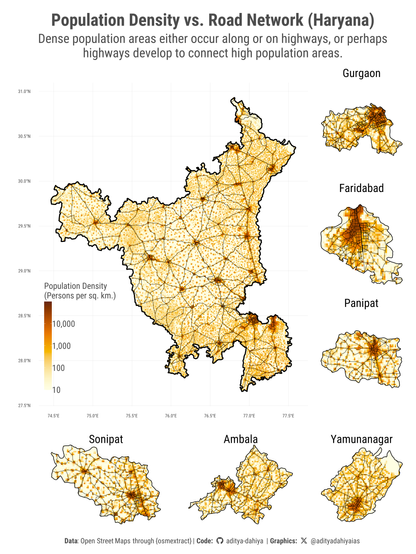
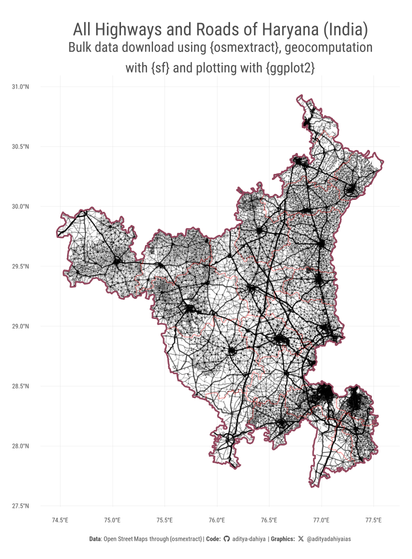
#OpenSource data and #R code for plotting Correlation between highways and densely-populated areas, globally. Example of Haryana (India).
Data: @openstreetmap @nasa

Full Code🔗https://tinyurl.com/hy-pop-roads

Tools: #rstats, #ggplot2, #tidyterra, #osmextract by @rOpenSci

Different Packages to access Open Street Maps in R – visage

#Maps #OpenSource code to plot correlation between changes in population density (in last 3 decades) and road network, e.g. #Delhi (#India)
Data: @openstreetmap @nasa

Full Code🔗https://tinyurl.com/delhi-pop-roads

Tools: #rstats #ggplot2 #tidyterra #osmextract by @rOpenSci

Population Density Rasters (globally) over time – visage

#DataVisualization #Maps A basic use for {osmextract} - quickly and easily plotting complete road network of any place in the world - example from Haryana (India).
Data: @openstreetmap
Full Code 🔗 https://tinyurl.com/osmextract-hy-roads
Tools: #ggplot2, #osmextract by @rOpenSci, #sf
Different Packages to access Open Street Maps in R – visage