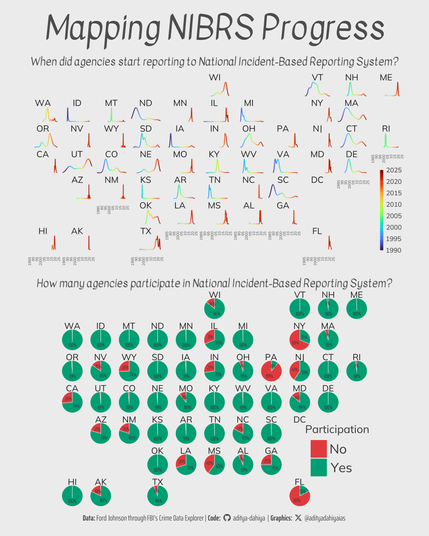
#TidyTuesday NIBRS adoption across the U.S.'s states. A creative hack to apply continuous color scales🎨 in geom_density(), and geographically arranged layouts using {geofacet}.

Full Code🔗https://tinyurl.com/tidy-fbi-nibrs
Tools: #rstats, #ggplot2, #geofacet

#OpenData

Mapping NIBRS Progress: State-by-State Adoption Rates and Historical Agency Enrollment – Data Viz Collective

#TidyTuesday Displaying geographic patterns in facet graphs with {geofacet} - change in water insecurity in USA's states (2022 vs 2023).
Data: {tidycensus} @nnpereira.bsky.social
Full Code🔗 https://tinyurl.com/tidy-plumbing
Tools #rstats #ggplot2 #geofacet by Ryan Hafen
Water Insecurity Across U.S. States: 2022 vs. 2023 – Data Viz Collective

Striking drop in annual growth of GDP per capita from 2019 to 2020 💸

A series of #dataviz|es as alternatives to two choropleth maps, comparing the trends per year as shared by Max Roser (OurWorldInData).

2️⃣ Slope graphs per country as tile grid map showing trends for each of the 186 countries featured.

🛠️ #rstats + #ggplot, in combination with the #geofacet ️📦 and #Figma to add the "how to" section + continent labels