Lisa Charlotte Muth

@lisacmuth@vis.social
3.3K Followers
278 Following
51 Posts
Creating & writing about dataviz for Datawrapper. Data Vis Book Club organizer. Fan of numbers, systems & overviews. I believe in maps, not the territory.
Websitehttps://lisacharlottemuth.com
Twitterhttps://twitter.com/lisacmuth
Datawrapper Bloghttps://blog.datawrapper.de

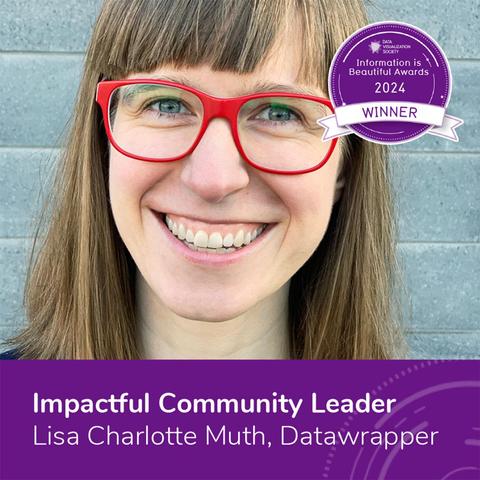
Wow! It's a great honor to receive this Information is Beautiful Award.

Thanks to @datawrapper for letting me help and inspire people. And thanks to everyone else who's contributing to the lovely #dataviz community – by sharing knowledge, hosting events/podcasts, and so much more!

Make sure to check out all the other #IIBAwards 2024 winners: https://www.informationisbeautifulawards.com/news/680-announcing-the-2024-winners

I put together an overview of chart types!
Which one of your favorites did I forget?

Here's the full article with explanations to all chart types: https://www.datawrapper.de/blog/chart-types-guide

🎉 New blog post! Choosing colors for a #dataviz on race, ethnicity or continents can be tricky. I collected lots of examples and wrote down 6 guidelines to help ensure all your readers feel respected by your color choices: https://blog.datawrapper.de/colors-for-race-ethnicity-world-regions/
What to consider when choosing colors for race, ethnicity, and world regions - Datawrapper Blog

What to keep in mind when choosing colors for a visualization with racial categories so that all readers feel respected.

Datawrapper Blog

🎉 New blog post! And — you guessed it — it's about small multiple line charts. When to use them instead of line charts? And how to make them easier to read and more beautiful to look at?

Our writer @lisacmuth covers the do's and don'ts: https://blog.datawrapper.de/what-to-consider-when-creating-small-multiple-line-charts/

What to consider when creating small multiple line charts - Datawrapper Blog

When to use small multiple line charts (vs. normal line charts) and how to create better ones. We'll cover the benefits of repeated lines, independent scales, sorting, colors, and more.

Datawrapper Blog

🎉🎉🎉 Big news: You can now create small multiple line charts with our new chart type “Multiple Lines”! Give each line its own panel, then sort, style, annotate, show lines on independent scales, and more.

See what’s possible in our announcement post: https://blog.datawrapper.de/small-multiple-line-charts/

New: Small multiple line charts in Datawrapper - Datawrapper Blog

You can now create small multiple line charts with our new chart type “Multiple Lines”! Give each line its own panel, add annotations and range highlights, show the lines on independent scales, and more.

Datawrapper Blog

📣 We’re excited to announce the first speakers for Unwrapped, the free, online Datawrapper conference on March 13-15:

👉 Amanda Cox will give a keynote on making better simple charts: https://blog.datawrapper.de/amanda-cox-bloomberg/
👉 Julius Tröger will talk about using Datawrapper for animations, live dashboards, and scroll formats: https://blog.datawrapper.de/zeit-online-julius-troeger/
👉 C.J. Sinner will share how she created four unique chart types out of Datawrapper scatterplots: https://blog.datawrapper.de/star-tribune-c-j-sinner/

Register here: https://www.datawrapper.de/unwrapped

Amanda Cox, Bloomberg, will give a keynote about making better simple charts - Datawrapper Blog

We're excited to announce that Amanda Cox will give the keynote at Unwrapped, the Datawrapper conference this March. She'll share insights from her many years

Datawrapper Blog

Happy New Year! Our Data Vis Dispatch is still on holiday break this week, but there are enough "Best #dataviz of 2023" lists on the internet to keep you busy for days 🧵:

🔷 Newsrooms:
----------------------
🔷 Axios: https://www.axios.com/2023-axios-visuals-year-in-review
🔷 The New York Times: https://www.nytimes.com/interactive/2023/us/2023-year-in-graphics.html
🔷 The Wall Street Journal: https://www.wsj.com/business/media/the-year-in-graphics-f3aaf872?mod=e2twg
🔷 Bloomberg: https://www.bloomberg.com/graphics/2023-in-graphics/
🔷 Texas Tribune: https://www.texastribune.org/2023/12/28/texas-tribune-data-visuals-top-stories-2023/
🔷 Los Angeles Times: https://www.latimes.com/projects/data-graphics-best-of-2023-maps-charts/
🔷 USA Today: https://eu.usatoday.com/story/graphics/2023/12/15/2023-year-in-review-visual-guide/71920351007/

Axios Visuals 2023 in Review

See Axios Visuals' best data visualizations, illustrations, comics and collaborations from 2023.

Today we published the last Dispatch of 2023 — and it's a special one, filled with the Datawrapper team's hand-picked visualizations from the past year. ✨ Did you encounter a chart that stayed in your mind this year?

👉 Read the full post here: https://blog.datawrapper.de/data-vis-dispatch-december-19-2023

The Dispatch will take a few weeks' holiday pause. See you in 2024! 🎆

Data Vis Dispatch, December 19 - Datawrapper Blog

Our team's favorite visualizations of 2023

Datawrapper Blog

We're excited to announce 🎁 Unwrapped, the Datawrapper conference! Unwrapped will happen virtually on March 14th and 15th, 2024.

Are you using Datawrapper in an unusual, creative, or simply successful way? Become a speaker & give a 5, 10, or 20 min talk: https://blog.datawrapper.de/call-for-speakers-unwrapped-datawrapper-conference/

Speak at Unwrapped, the Datawrapper conference! - Datawrapper Blog

Share your idea for a talk at Unwrapped, the virtual Datawrapper conference in March 2024.

Datawrapper Blog

📣 The next meeting of our data vis book club is happening on January 29th at 5pm UTC!

We'll be discussing “Questions in Dataviz” by Neil Richards on this notepad: https://notes.datawrapper.de/p/questions-in-dataviz

More information in the announcement on our blog 👇
https://blog.datawrapper.de/questions-in-dataviz-book-club/

Datawrapper Notes