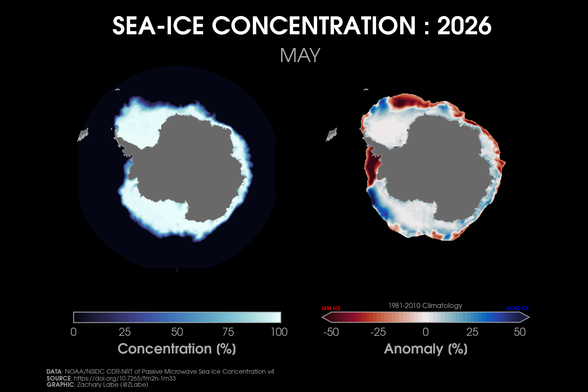
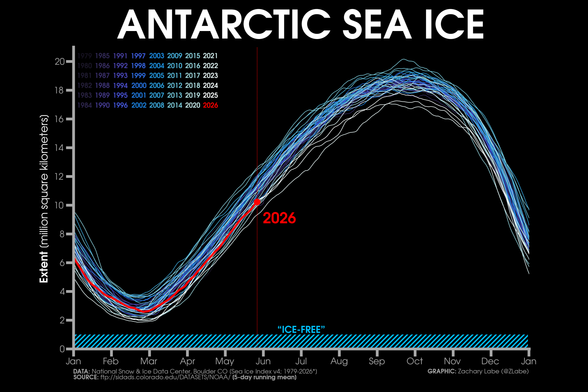
🚨 It’s official: 2026 had the lowest annual maximum Arctic sea ice extent on record - essentially tied with last year’s record low.
Climate change is reshaping the Arctic, and it's all throughout the year.
For more information from: https://nsidc.org/news-analyses/news-stories/arctic-sea-ice-record-low-maximum-strikes-again
Our latest Climate Shift Index alert is out, summarizing the additional record heat this week: https://www.climatecentral.org/climate-shift-index-alert?#record-breaking-march-heatwave-intensified-by-climate-change-continues-to-shatter-records-across-the-us
"From March 24 through 27, more than 42.5 million people across the western U.S. will experience at least one day with maximum temperatures at CSI of 3 or higher, indicating a strong influence from climate change."
Join our press briefing later today with Covering Climate Now for more: https://coveringclimatenow.org/event/press-briefing-virtually-impossible-heat-the-future-of-the-american-west/
Temperatures were much warmer than average during the last three months across most latitude bands outside of the Antarctic.
[Plot shows zonal-mean surface air temperature anomalies, where latitude = y-axis (not scaled by distance). Data: GISTEMPv4 (1951-1980)]
Looking for clear visualizations of the latest climate change data? 📈🌎
Feel free to use and share any of my real-time graphics. I am also working (in my free time) to secure alternative data sources in case of future federal budget cuts. Let me know if you have questions or if these visuals help your work – I always love hearing how they are used!
+ Global climate change indicators: https://zacklabe.com/climate-change-indicators/
+ U.S. Climate Indicators: https://zacklabe.com/united-states-climate-indicators/
+ Polar climate indicators: https://zacklabe.com/arctic-sea-ice-figures/
+ My monthly blog series: https://zacklabe.com/climate-viz-of-the-month/
+ Arctic sea-ice extent: https://zacklabe.com/arctic-sea-ice-extentconcentration/
+ Arctic sea-ice thickness and volume: https://zacklabe.com/arctic-sea-ice-volumethickness/
+ Arctic temperatures: https://zacklabe.com/arctic-temperatures/
+ Antarctic sea ice: https://zacklabe.com/antarctic-sea-ice-extentconcentration/
+ Global sea ice: https://zacklabe.com/global-sea-ice-extent-conc/
+ Arctic climate model projections: https://zacklabe.com/climate-model-projections/
+ Arctic seasonal graphics: https://zacklabe.com/arctic-climate-seasonality-and-variability/
+ FAQ: https://zacklabe.com/frequently-asked-questions/
+ My methods: https://zacklabe.com/methods-and-open-software/
+ My data sources: https://zacklabe.com/resources-and-data-references/
This is an unexpected opportunity. Speed, safety, security, and efficiency would be key I would think.
Global marine surface meteorological variables from 1850 to 2024 now available in the Climate Data Store (CDS). This new version (2.0.0) includes additional drifting buoy data reprocessed by the C‑RAID project.
Access the resource: https://cds.climate.copernicus.eu/datasets/insitu-observations-surface-marine?tab=overview

It is difficult to describe how bonkers this week’s heat wave is in the southwestern United States. Alan Gerard, a typically even-keeled meteorologist with 35 years of forecasting experience under his belt, attempted to do so in a recent edition of his newsletter, Balanced Weather. He settled on: “j...
This is quite a map - highlighting that 2026 is leading the way for many stations stretching across the entire contiguous United States in the number of 80°F days (year-to-date). Remarkable areal extent of summer-like warmth... 🔥
Map from the Southeast Regional Climate Center: https://sercc.com/