oh man where was this article when i needed it https://www.experimental-history.com/p/the-rise-and-fall-of-peer-review
h/t @jzong
h/t @jzong

researcher and visual artist. data representation, refusal, embodiment.
postdoc mit
berkman klein fellow harvard
incoming asst prof cu boulder info sci (starting F2025).
forbes 30 under 30.
anime, video games, taekwondo
| website | https://jonathanzong.com/ |
| research group | https://data-and-design.org/ |
how can participatory science improve safety and accountability in our digital environments?
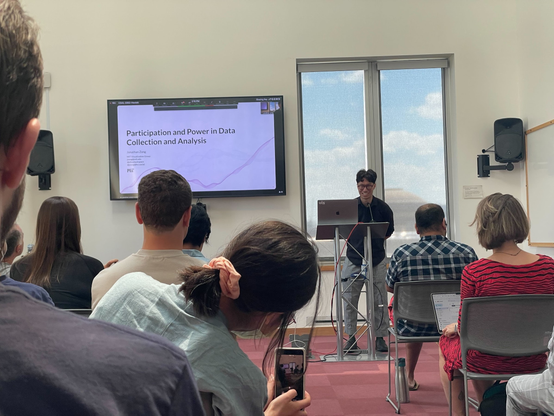
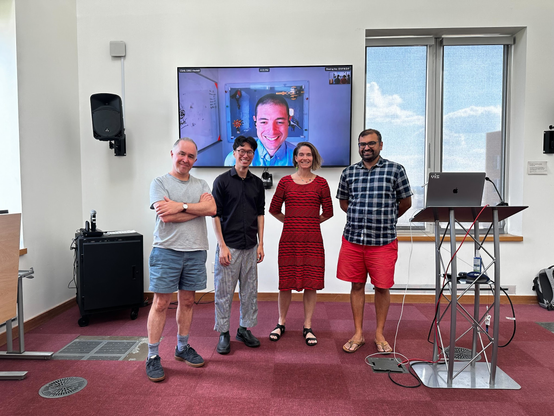
last week, i helped host @natematias at @bkc and attended his public talk at MIT's data + feminism lab.
check out my post about the talk below:
https://data-and-design.org/blog/2024/10/25/improving-our-digital-environments/

Last week I had the pleasure of hosting J. Nathan Matias, assistant professor of communication at Cornell University and director of the Citizens and Technology Lab, for a conversation at the Berkman Klein Center at Harvard. I also attended his public talk later that day at MIT DUSP, hosted by the Data + Feminism Lab. I’m sharing this post based on his talk as a resource for those who were not able to attend.
Scholars: what you trying in order to organize & support networks of community among emerging scholars?
Today across the extended CAT Lab network, we had a revealing conversation; gradstudents reported that microblogging platforms exposed them to risk/harassment with little reward, and that they were unsure how to find peers & community elsewhere, aside from becoming an "influencer," which only some found palatable.
Are you seeing the same? What can we do about this?
interested in accessibility, visualization, and data ethics? i'm recruiting phd students to join the Data & Design Group at CU Boulder.
we're building a collaborative and inclusive space for people to grow into interdisciplinary researchers of technology and society.
hi! i will be presenting this work at #chi2024 next week.
i'm also pleased to share that i will be joining the faculty at
CU Boulder Information Science in 2025, and intend to recruit students soon.
please get in touch if you'd like to chat at the conference. thanks!
For blind and low-vision (BLV) people to equally participate in data analysis, they must be able to not only consume data representations created by others, but also create their own. Unfortunately, existing accessible tools assume the existence of a visualization that can then be converted into an accessible representation. Introducing Umwelt, a tool for interactive data analysis that de-centers visualization by treating visuals, text, and sound as equal modalities: https://news.mit.edu/2024/umwelt-enables-interactive-accessible-charts-creation-blind-low-vision-users-0327
coming soon to #chi2024

We present Umwelt, an authoring environment for interactive multimodal data representations. In contrast to prior approaches, which center the visual modality, Umwelt treats visualization, sonification, and textual description as coequal representations: they are all derived from a shared abstract data model, such that no modality is prioritized over the others. To simplify specification, Umwelt evaluates a set of heuristics to generate default multimodal representations that express a dataset's functional relationships. To support smoothly moving between representations, Umwelt maintains a shared query predicated that is reified across all modalities -- for instance, navigating the textual description also highlights the visualization and filters the sonification. In a study with 5 blind / low-vision expert users, we found that Umwelt's multimodal representations afforded complementary overview and detailed perspectives on a dataset, allowing participants to fluidly shift between task- and representation-oriented ways of thinking.
For blind and low-vision (BLV) people to equally participate in data analysis, they must be able to not only consume data representations created by others, but also create their own.
Unfortunately, existing accessible tools assume the existence of a visualization that can then be converted into an accessible representation.
Introducing Umwelt, a tool for interactive data analysis that de-centers visualization by treating visuals, text, and sound as equal modalities:

Umwelt is a new a system that enables blind and low-vision users to author accessible, interactive charts representing data in three modalities: visualization, textual description, and sonification.