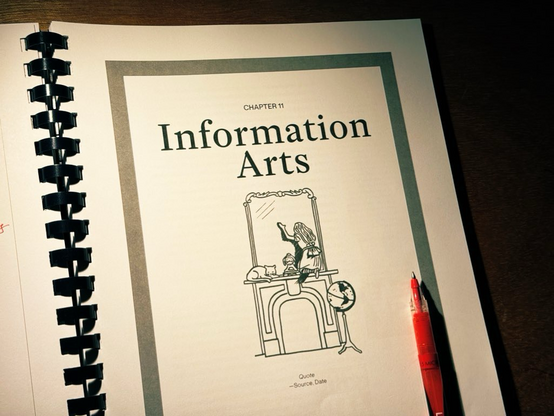
Fresh chapter defragmentation. Epigraph TBD. #infoWeTrustRemastered


Data storyteller RJ Andrews helps organizations solve high-stakes problems with visual metaphors and information graphics: charts, diagrams, and maps. RJ’s recently published Information Graphic Visionaries is a new book series from Visionary Press celebrating spectacular data visualization creators. His first book is Info We Trust, How to Inspire the World with Data. Data stories presented to or received coverage from: AAAS Science, Airbnb, ASA Chance, Anheuser-Busch, Asana, BBC More or Less, Business Insider, BuzzFeed, Colossal, Corriere Della Sera, Design Boom, Ditchley Foundation, Duke University, Facebook, Fast Company, FDA, Flaunt magazine, Huffpost, Its Nice That, Le Monde, Microsoft, MIT, National Geographic, Netflix, Oprah magazine, PRINT magazine, Richard Branson, RSS Signficance, Scientific American, Smithsonian, Stanford University, USAID, The White House. Publications collected by: American Philosophical Society, Amherst College, Boston Public Library, University of Colorado Boulder, David Rumsey Map Collection, University of Denver, Durham University, Florence Nightingale Museum, Free University of Berlin, University of Illinois Urbana-Champaign, University of Lethbridge, Library Company of Philadelphia, London College of Communication, MIT, Michigan State University, Middlebury College, Newberry Library, North Carolina State University, Norwegian University of Science and Technology (NTNU), University of Oregon, University of Southern Maine, Skidmore College, Stanford University, Tokyo Keizai University, University of Toronto, U.S. Library of Congress, Utrecht University Library, Wichita State University, University of Wisconsin–Milwaukee, Zentralbibliothek Zürich.
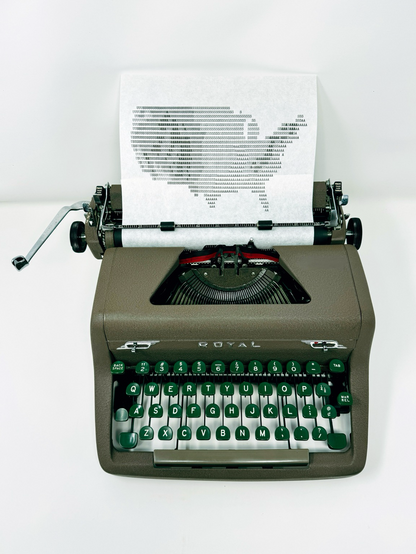
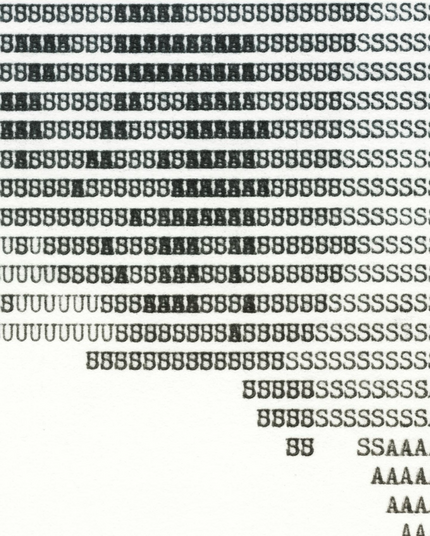

Concrete poetry in 1930s charts. That and more coming to the next edition of CHARTOGRAPHY.
charts.substack.com

Tomorrow's issue of CHARTOGRAPHY will conclude with our first Bonus Graphic for paid subscribers.
Material supporters help us unearth more data-graphic treats, and raise the status of our craft everywhere. charts.substack.com

What's your favorite chart you've seen this week?
I'll go first. From November 1941 TIME magazine:


