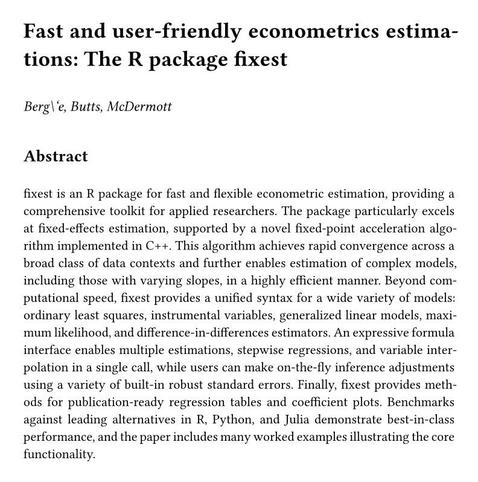
After an interminable delay, we finally managed to finish up the `fixest` paper (and submit for review). WP version available on Arxiv: https://arxiv.org/abs/2601.21749
Please consider citing if you are a `fixest` user!

| Website | https://grantmcdermott.com |
| GitHub | https://github.com/grantmcdermott |
After an interminable delay, we finally managed to finish up the `fixest` paper (and submit for review). WP version available on Arxiv: https://arxiv.org/abs/2601.21749
Please consider citing if you are a `fixest` user!
New features include:
- fast binscatter regression on a database backend
- new acceleration strategies
- analytical clustered SEs
- interaction terms support
- stats methods (predict, vcov, etc.)
- integration with tabling sw
- etc.
Full v0.0.3 changelog: https://grantmcdermott.com/dbreg/NEWS.html#dbreg-0.0.3
[2/2]
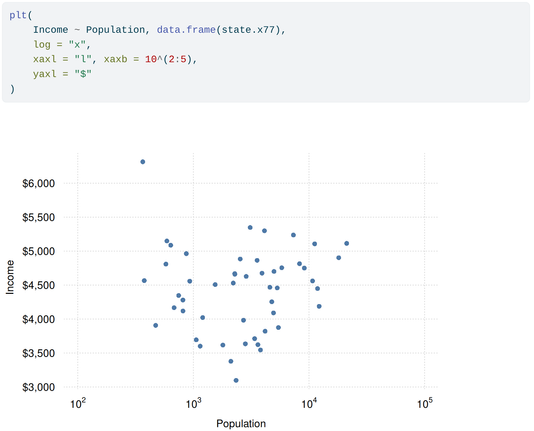
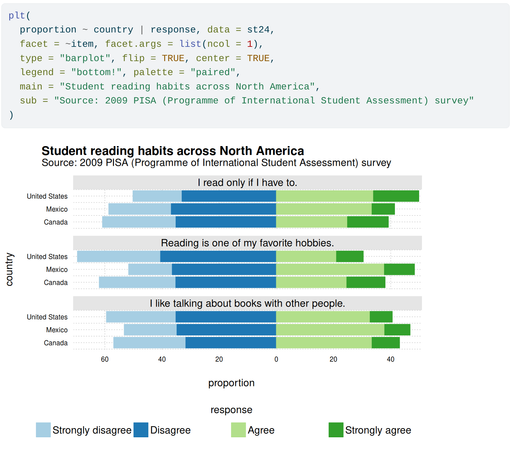
Happy `tinyplot` v0.6.0 (codename "Thanksgiving") release day to all those that celebrate. Some new features, but mostly bug fixes and internal improvements. https://grantmcdermott.com/tinyplot/NEWS.html#v0.6.0

`tinyplot` 0.5.0 is now available from CRAN & R-universe. Alongside bug fixes & internal improvements, this release includes some cool new features like bubble chart + dual legend support, element dodging, & ephemeral themes.
Detailed changelog: https://grantmcdermott.com/tinyplot/NEWS.html#section

To borrow another example, taken from the `dbreg` README: https://github.com/grantmcdermott/dbreg
Here I am running a fixed-effects regression on 180 million(!) row parquet dataset... and it completes **< 2 seconds**... on my laptop 🤯
This is powered by @duckdb under the hood.

Mini update to the {tinyplot} "Tricks & tips" vignette: How to plot direct labels in a grouped line plot.
https://grantmcdermott.com/tinyplot/vignettes/tips.html#direct-labels
P.S. You'll need the dev version of the 📦 for this.

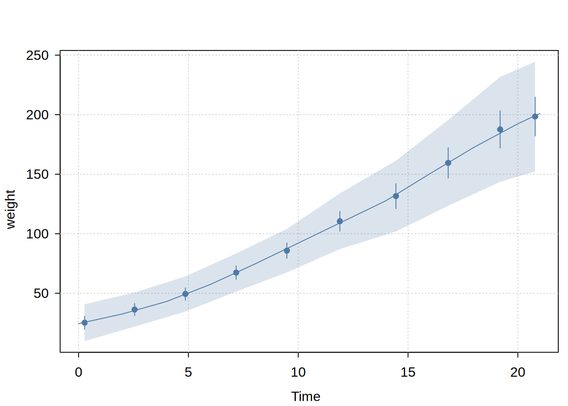
4. Better NSE support means less typing for plots with x/ymin and x/ymax values, e.g. coefficient plots.
(We plan to expand this smart NSE passing to equivalent arguments like weights and subset in a future release.)