208 Followers
100 Following
52 Posts
one half of @IrishEnergyBot + @USEnergyBot; previously grid edge research @greentechmedia
Twitterhttps://twitter.com/_fei_wang
Green Collectivehttps://www.greencollective.io/

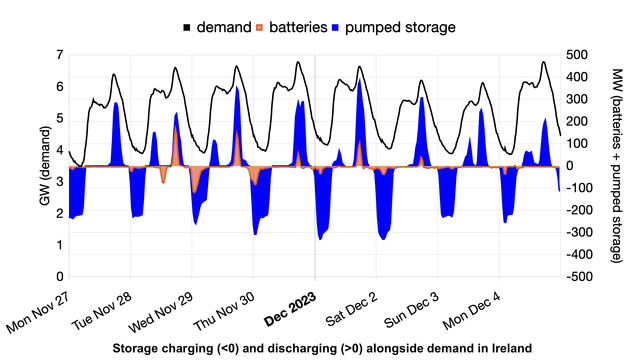
Plotted pumped storage and batteries to cover all storage capacity in Ireland. Looks like batteries stopped discharging during peak since Sunday after a multi-day test?

*Note demand and storage on separate y-axes* (This is not ideal to me, but the patterns are the takeaway here!)

This seems to be the beginning of battery energy storage in Ireland discharging in concert to meet peak demand! Before last Tuesday, batteries would usually behave what you see below for Monday, as they provide ancillary services. Since then, new dispatch patterns emerged. (1/2)

Exciting times on the grid in California and Texas with multiple records in April 2023:

1) Record-level solar generation: 14,761MW in CAISO on Apr 27; 12,749.6MW in ERCOT on Apr 30.
2) Battery discharge reached 3,518MW on Apr 3 in CAISO.
3) For the first time in CAISO, net load (load minus solar/wind) became negative and on multiple days: Apr 16, 23 & 30.
4) In ERCOT, a record share of demand met by instantaneous inverter-based resources (solar, wind, and storage): 69.3% at 11:10am on Apr 29.

Grid-scale battery storage discharge reached 3.5GW for the first time in CAISO yesterday. Looking back at historical data, you can clearly see that batteries are here to stay and new records will keep coming!
One goal for the energy bots in 2023 is to exist outside of Twitter too. As of today, you can view current and historical daily reports on our website: https://www.stillatthewind.com/explore. In fact, historical daily reports on the website stretch back to earlier than our first tweets. Pick a market and date, and happy browsing!
Still at the Wind

If the method is correct, 43% of solar curtailment seems a lot. However, based on the LBNL utility-scale solar report, from Feb to Apr 2021, monthly ERCOT solar curtailment was above 16%, so maybe a spike of 43% is not impossible. (10/11) https://emp.lbl.gov/sites/default/files/utility_scale_solar_2022_edition_slides.pdf
Using this method, on Jan 16, wind curtailment in ERCOT was 3.9% and solar 5.8%. On Jan 18, with more wind gen, wind curtailment was 5.7%, and solar curtailment rate on average reached a whopping 43.1%. Hourly data for solar and wind shown below. (8/11)
Looking more closely at wind and solar generation, while wind generation remained high during the day on January 18, solar generation looks flattened on the hourly chart below. (4/11)
Since the US Energy Bot only started tracking ERCOT in mid-January, the overlap with 60-day SCED disclosure data is small, but I will use January 16 and 18 as an example. On January 16, wind made up 40% of generation in ERCOT and 49% on January 18. (3/11)

distribution grid/network doesn’t even make it to the meme 😭

RT @[email protected]

Non-energy dudes on my Facebook and Instagram right now

🐦🔗: https://twitter.com/MelPoweredUp/status/1603357999531270144

Melissa Alfano on Twitter

“Non-energy dudes on my Facebook and Instagram right now”

Twitter