Want to learn how to make a #dataviz or run an #analysis on ecological/biological data in R?
Check out ALA Labs to to find something new!
Data Analyst & Science Lead @ Atlas of Living Australia | Evolutionary biologist & social psychologist (PhD) 🧪 | #rstats | Music enthusiast 🎶
(he/him)
| Website | https://daxkellie.com/ |
| GitHub | https://github.com/daxkellie |
Want to learn how to make a #dataviz or run an #analysis on ecological/biological data in R?
Check out ALA Labs to to find something new!
After I shared an animal dataviz earlier this month, some people asked to see the plants version 🌱 So here it is!
Plant observations added to the Atlas of Living Australia in 2024! 🌏🌼 Flowering plants really dominate!
For biodiversity month, I made this #dataviz of animal observations added to the Atlas of Living Australia in 2024! 🌏
🐦 Perching birds (eg songbirds, finches, magpies) are truly #1 🥇 & for good reason: They represent > half of all bird species globally!
code: https://github.com/AtlasOfLivingAustralia/science/blob/main/comms/2024-09-10_animalia/bubble-chart.R
I was having a real problem using {testthat} on a function with lots of {cli} messages because messages printed in my tests even though I didn't want them to 😑
But then I came across `purrr:quietly()`, which captures output, warnings and messages in a list rather than in the console 😀
I only just discovered the `lst()` function from the {tibble} package, but it is so wonderfully convenient if you work with lists!
Normally, naming & renaming list elements is a pain 😑, but `tibble::lst()` retains the names of the elements used to make the list 😎
🐝 A blue banded bee for #NationalHoneyBeeDay!
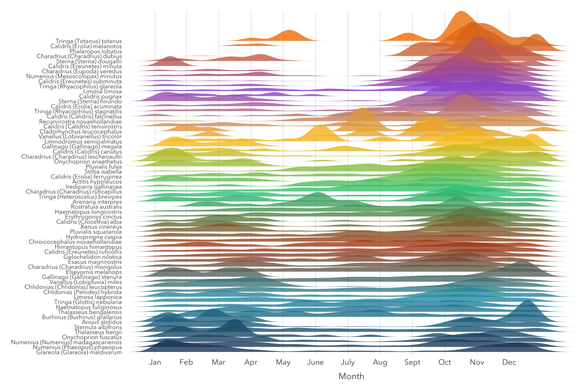
Every circle’s size is proportional to the number of observations each day since 2001
Data cleaning is hard. Want to make it shrimp-ler? 🦐
Check out the new book we wrote about cleaning data in R for ecologists & biologists! 😀
https://cleaning-data-r.ala.org.au/
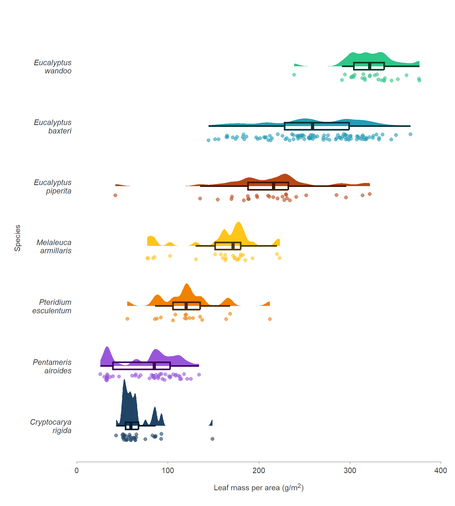
Learn to make pretty ridgeline plots using {galah} & {ggridges} in a new ALA Labs post by Olivia Torresan & me! 🤩
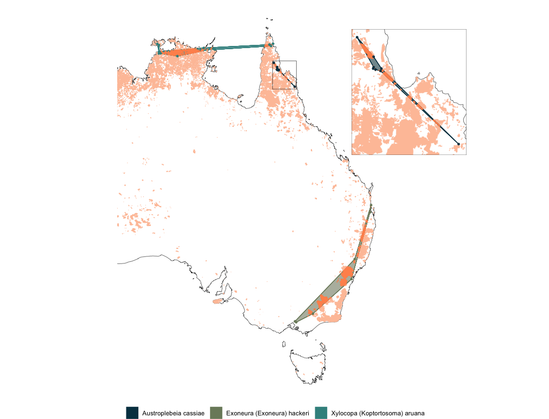
Learn how to run a species distribution model using {tidymodels} and {tidysdm} in a new ALA Labs post by me & Shandiya Balasubramaniam 🐦🌏

