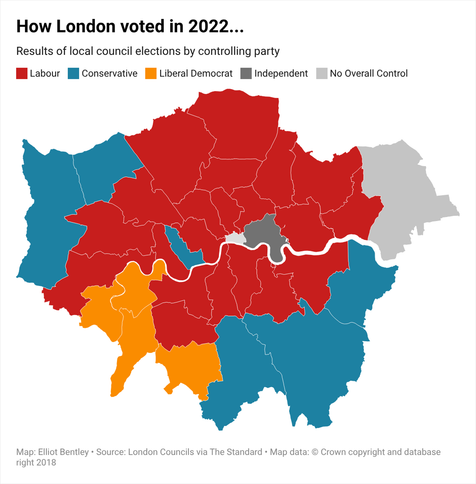
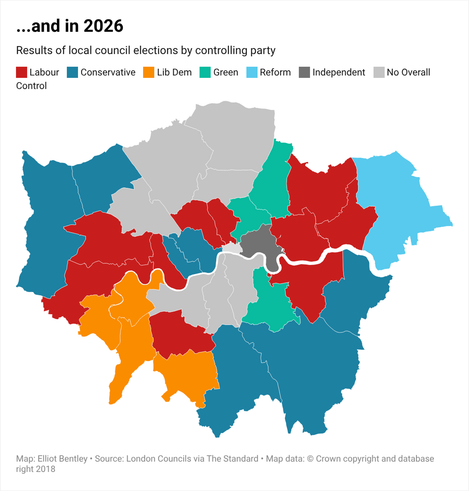
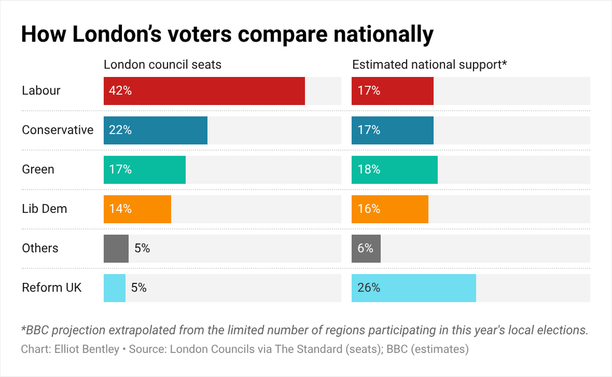
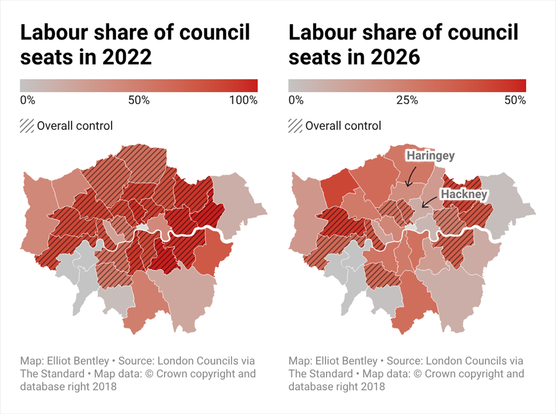
Last week, Londoners voted in local elections. What was different this time around, and how does London compare to the rest of the U.K.? 🗳️
Our vis developer Elliot (@ejb) walks us through the results. 📊 👇

| Website | https://www.datawrapper.de |
| Blog | https://www.datawrapper.de/blog |
| Get in touch | https://www.datawrapper.de/contact-us |
| Join us | https://datawrapper.de/careers |
Last week, Londoners voted in local elections. What was different this time around, and how does London compare to the rest of the U.K.? 🗳️
Our vis developer Elliot (@ejb) walks us through the results. 📊 👇
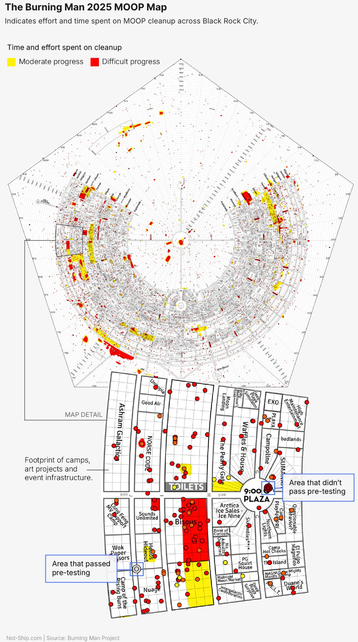
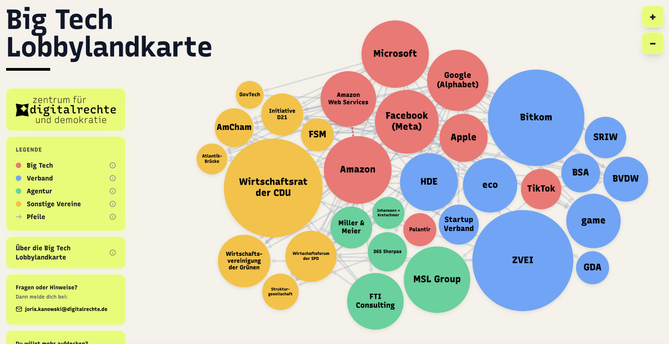
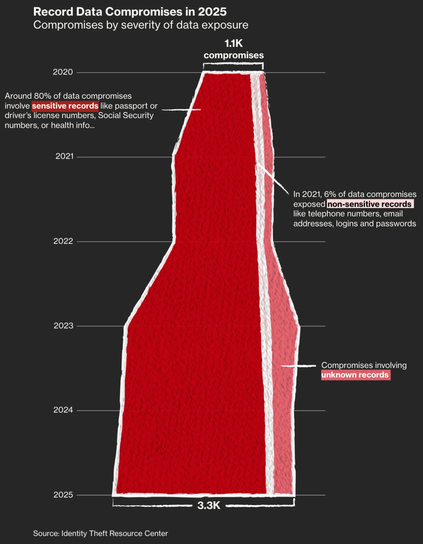
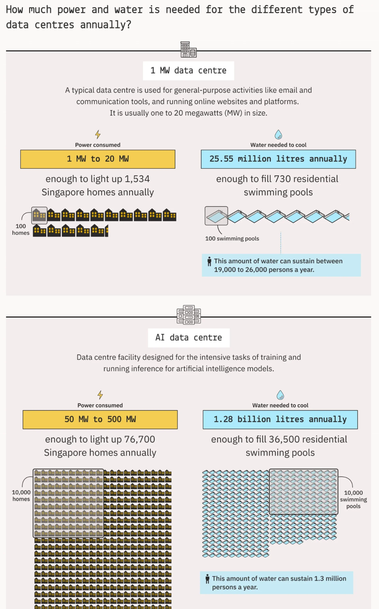
Data plays a big role in the boom of AI, from data centers 🏢, to security concerns, and onto AI chatbots promoting stereotypes 🤖. Data has also been logged to create the 2025 Burning Man MOOP map! Check out these topics and more in the Data Vis Dispatch. 👇
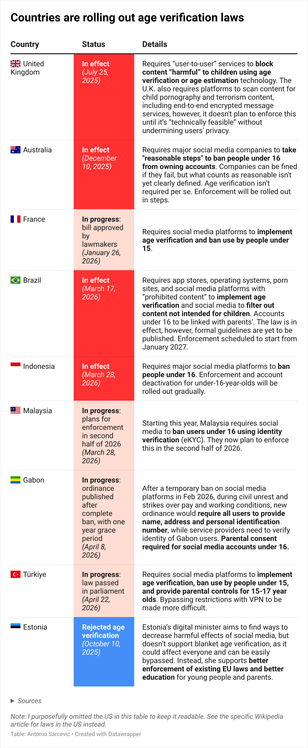
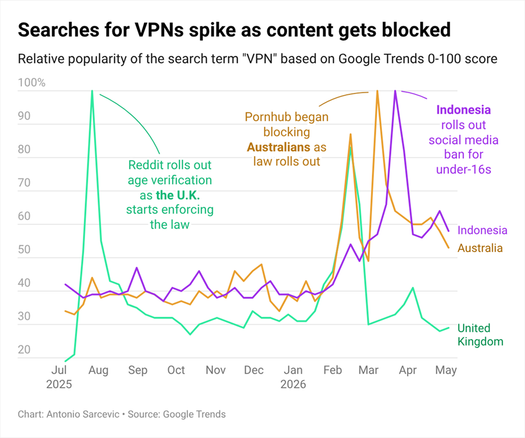
Is it protecting children's safety or putting our privacy at risk? Today, our app developer Toni (@linkplay) takes stock of the latest developments in online age verification and discusses its shortcomings. 🔞 📱 📈
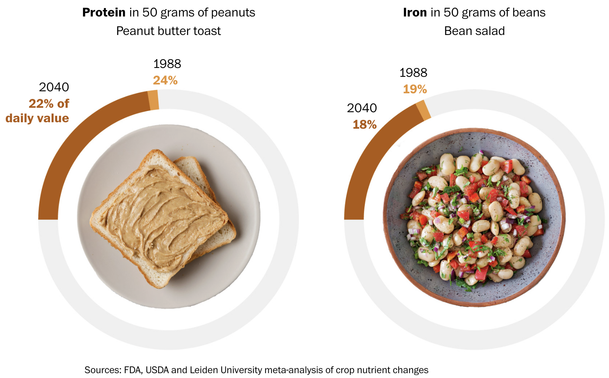
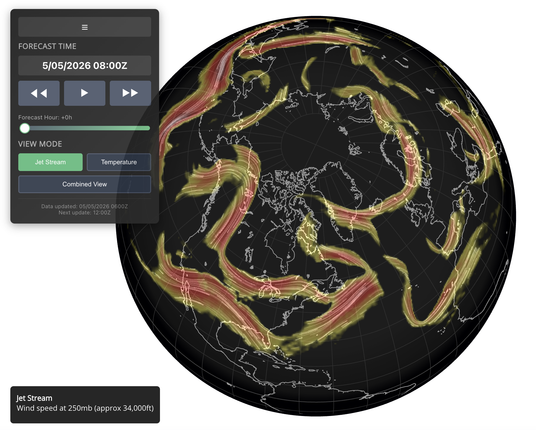
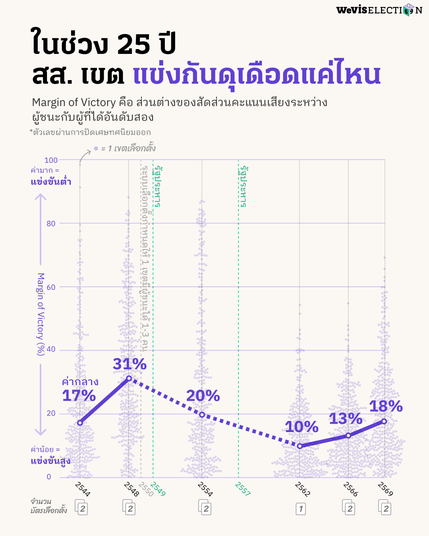
Changes can be found in a variety of areas, ranging from nutrients in crops and the flow of jet streams to Thai democracy and even the habitats of parrots. Explore these topics and more in the Data Vis Dispatch. 👇
https://www.datawrapper.de/blog/data-vis-dispatch-may-5-2026-soccer-health-and-parrot-species

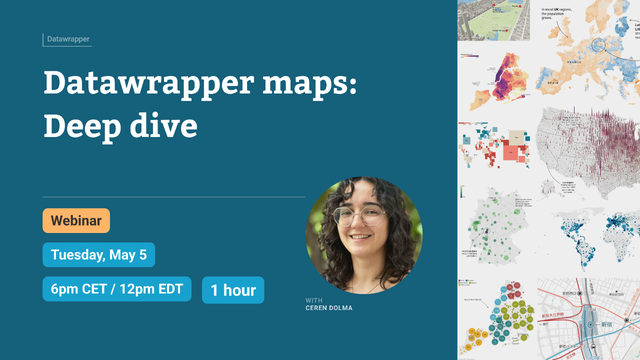
🌎 Join us *tomorrow*, May 5th at 6pm CET/12pm EDT for a deep dive on Datawrapper maps: What types are there? What can you do with them?
There are still spots left: https://watch.getcontrast.io/register/datawrapper-maps-deep-dive
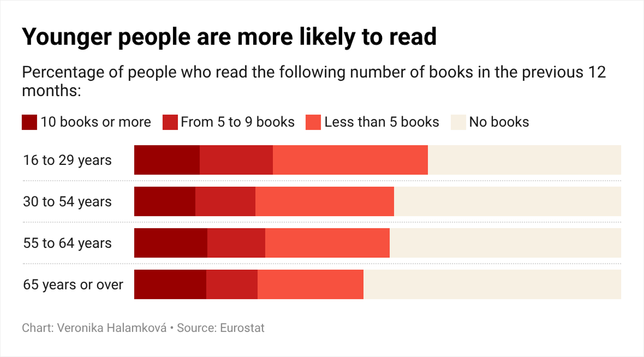
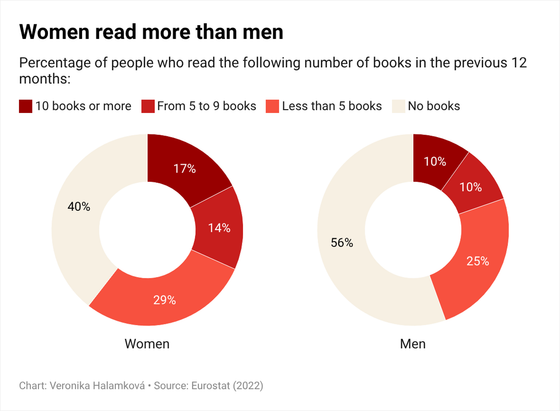
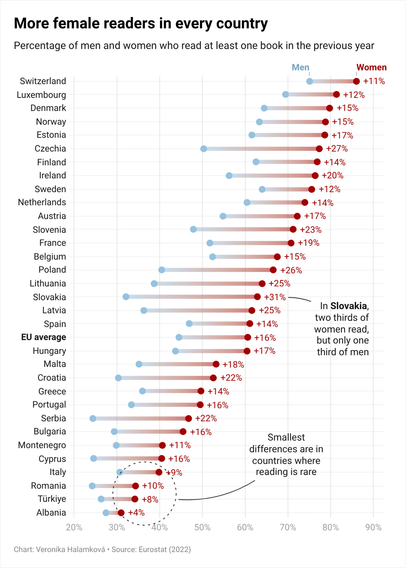
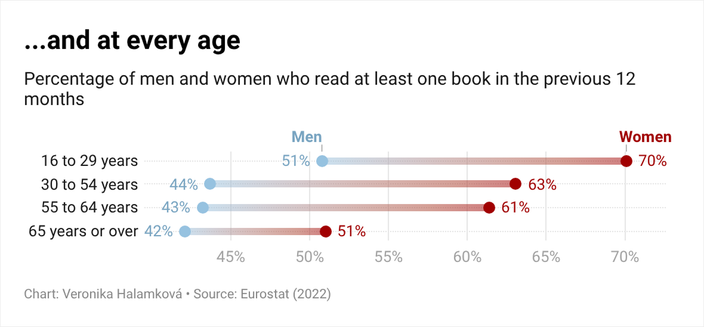
As a late celebration of World Book Day, our writer Veronika examined Europeans' reading habits and found something unexpected: a gender reading gap! 📊 📚 👀
Read more about our (lack of) reading on the Datawrapper blog: 👇
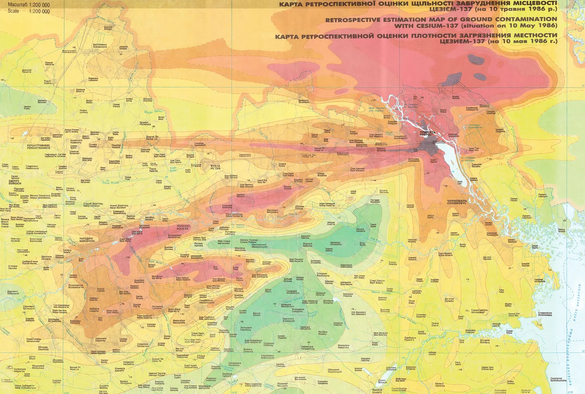
The White House Correspondents’ Dinner 🇺🇸, the 40th anniversary of the Chernobyl disaster ⚠️, and an updated version of the famous warming stripes 🌍 are among the key events covered in this week's Dispatch. Find these topics and much more on the Datawrapper blog.👇


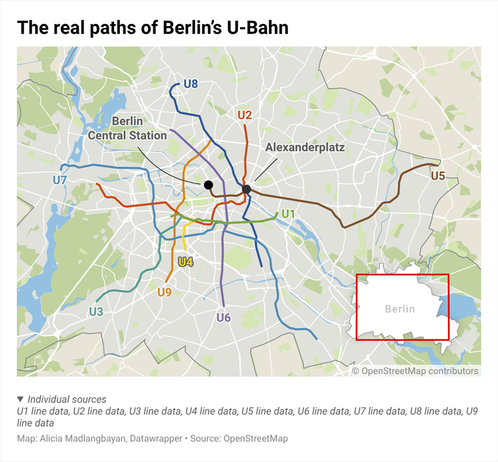
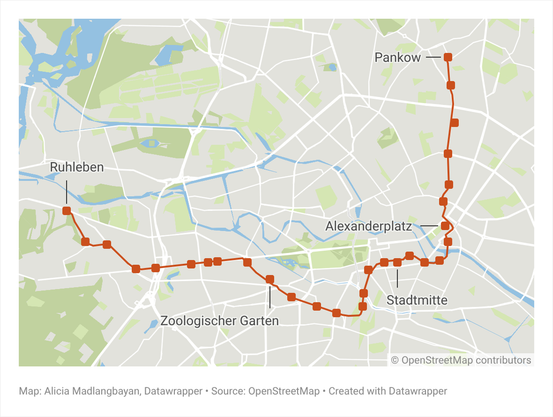
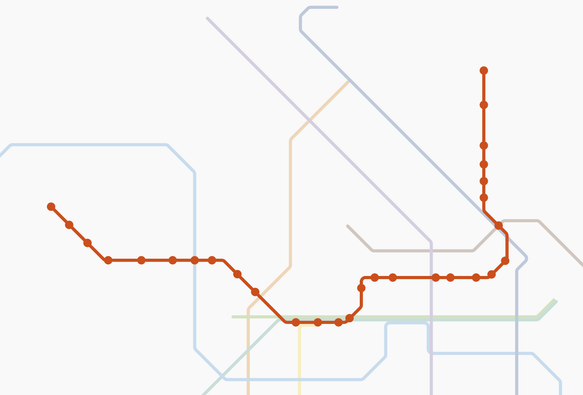
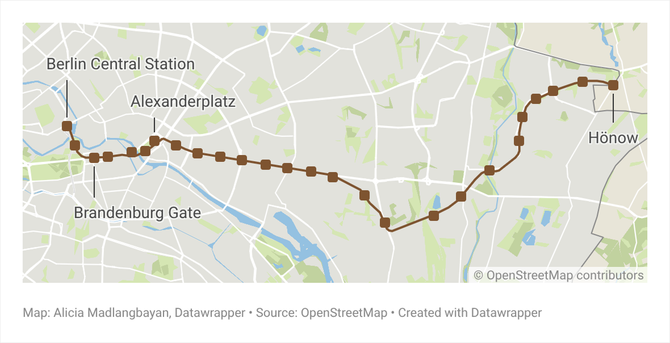
The best maps aren't always the most accurate ones. That's what our designer Alicia points out in her Weekly Chart, as she compares the diagram of Berlin's U-Bahn lines to the usual city map. 🪢 🚇 🗺️
How do they differ? Find out on the blog👇
https://www.datawrapper.de/blog/public-transport-maps-berlin
We just scheduled two free webinars for May 🗓️
🌎 May 5th, 6pm CET/12pm EDT: Maps deep dive: https://watch.getcontrast.io/register/datawrapper-maps-deep-dive
🚀 May 12th, 6pm CET/12pm EDT: Getting started with Datawrapper: https://watch.getcontrast.io/register/getting-started-with-datawrapper
Both are free — we hope to see you there!