#rstats #dataviz #psy6136
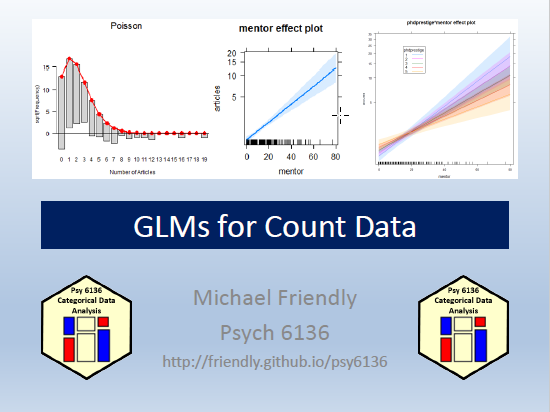
Lecture 9 for my course in Categorical Data Analysis-- Count Data Models
📋 Materials: https://friendly.github.io/psy6136/#GLMs_for_count_data
🎞️ Slides: https://friendly.github.io/psy6136/lectures/09-CountData.pdf


| Web | https://datavis.ca |
| GitHub | https://github.com/friendly |
| GH pages | https://friendly.github.io/ |
#rstats #dataviz #psy6136
Lecture 9 for my course in Categorical Data Analysis-- Count Data Models
📋 Materials: https://friendly.github.io/psy6136/#GLMs_for_count_data
🎞️ Slides: https://friendly.github.io/psy6136/lectures/09-CountData.pdf
#rstats #dataviz #psy6136
BONUS lecture for my course in Categorical Data Analysis-- Deep Questions of Data Visualization
First ever study of graphical preferences among marine animals!! 🦈🐢🐟
WINNER of the Red Stripe Award, 2026!! 🎖️🎖️
Slides: https://friendly.github.io/psy6136/lectures/DeepQuestions.pdf


#rstats #dataviz #psy6136
Lecture 6 for my course in Categorical Data Analysis-- Logistic Regresson
Materials: https://friendly.github.io/psy6136/#Logistic_regression
Slides: https://friendly.github.io/psy6136/lectures/06-Logistic.pdf


#rstats #dataviz #psy6136
Lecture 5 for my course in Categorical Data Analysis-- Correspondence Analysis
Materials: https://friendly.github.io/psy6136/#Correspondence_Analysis
Slides: https://friendly.github.io/psy6136/lectures/05-Corresp.pdf


#rstats #dataviz #psy6136
Lecture 2 for my course in Categorical Data Analysis, on discrete distributions
Slides: https://friendly.github.io/psy6136/lectures/02-Discrete.pdf


#rstats #dataviz #psy6136
Gave the first lecture for my course in Categorical Data Analysis
Slides: https://friendly.github.io/psy6136/lectures/01-Overview.pdf


ANNOUNCE: #dataviz #rstats
This winter I'm teaching a new instance of my course on Categorical Data Analysis, featuring analysis and
visualization methods for frequency data and model-based methods (loglinear models, logistic/Possion regression).
I'll post some weekly highlights.
Course materials (lecture slides, #rstats examples, etc.) are available at:
https://friendly.github.io/psy6136/
but still being revised.