London
#dataviz folks, this free event next Tuesday could be of interest to you, with two great talks on ethical data viz and Palestine Open Maps:
https://lu.ma/2imvck4t
London Data Visualisation · Luma
If you feel inspired by the visual journalism of the New York Times, winners of the Information is Beautiful awards or the wonderfully crafted graphics of great communicators like Mona...
#DigThisViz
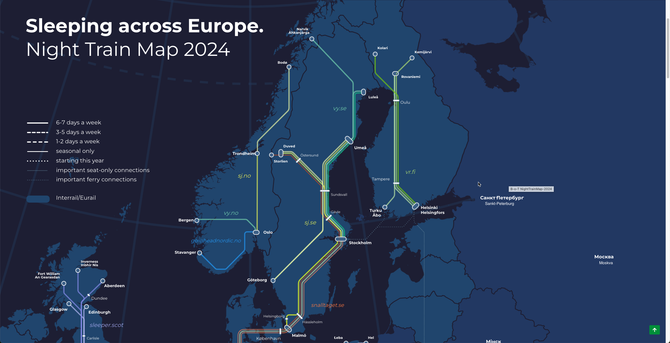
Sometimes, you see a viz so useful you wonder how you lived without it before. I present to you: the map of night trains in Europe
https://back-on-track.eu/night-train-map/
Night Train Map 2026 – Back-on-Track
#DigThisViz I have seen this piece in so many ‘Best of 2023’ dataviz lists and it’s no surprise: Giorgia Lupi’s piece on living with long covid is everything you can expect: moving, beautiful, and a human story.
https://www.nytimes.com/interactive/2023/12/14/opinion/my-life-with-long-covid.html #dataviz 
Opinion | My Life With Long Covid
Chronic illness has a way of picking apart your mind and breaking your heart.
Since this is my first post from my new profile, perhaps a little intro? 👋
By day, I'm a data analyst at LinkedIn. By evening, I overanalyse TV series 📺 , music 🎵 or Eurovision 🇪🇺 .
So far, my main tool has been Tableau (3 'Viz of the Day' and in the Top 10 Qualifiers of Tableau's annual competition Ironviz in 2021) but I am building skills in D3 and Svelte.