#DigThisViz
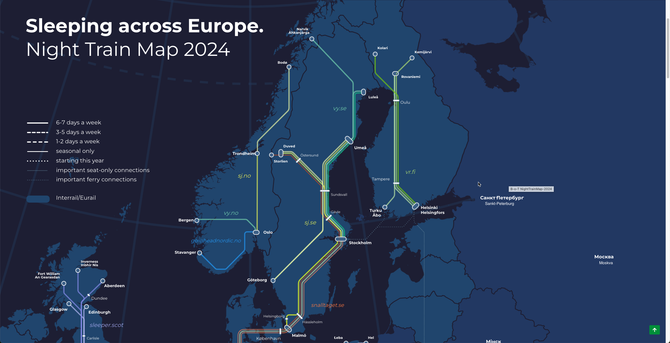
Sometimes, you see a viz so useful you wonder how you lived without it before. I present to you: the map of night trains in Europe
#DigThisViz
Sometimes, you see a viz so useful you wonder how you lived without it before. I present to you: the map of night trains in Europe

📢New in MEAP📢
Make sense of your data—by making it visual
Data storytelling can make all the difference between a data-confused audience and getting the point across in a clear way.
In Everyday Data Visualization Desireé Abbott will teach you to effectively communicate your data's value and make complex data easily understandable - by making it visual: http://mng.bz/lJOd
Get 45% off with code mlabbott till Mar 23
#dataviz #datascience #businessanalyst #digthisviz #datafam #tableau #d3 #ggplot
Radically improve the quality of the data visualizations you do every day by mastering core principles of color, typography, chart types, data storytelling, and more!</b> In Everyday Data Visualization</i> you’ll learn important design principles for the most common data visualizations: Harness the power of perception to guide a user’s attention</li> Effectively use color and other design fundamentals to bring data to life</li> Choose the best chart type for the data and the story you want to tell</li> Design for interactive visualizations</li> Keep the user’s needs first throughout your projects</li> </ul> Everyday Data Visualization</i> is a field guide for design techniques that will improve the charts, reports, and data dashboards you build every day. The foundation of data visualization is storytelling, and this book gives you the tools you need to start telling those stories with clarity, precision, and flair! You’ll learn how human brains perceive and process information, master modern accessibility standards, get the basics of color theory and typography, and more!
