and did some graphics for a WEF report which the team and I are writing up as separate blogposts - first one: https://blogs.thomsonreuters.com/answerson/data-science-legal-data-privacy/
briromer
@briromer@vis.social
- 45 Followers
- 52 Following
- 118 Posts
dataviz lead at thomson reuters labs
also, I forgot - I wrote up my #codevember adventure with p5.js https://blog.prototypr.io/what-i-learned-in-almost-30-days-of-codevember-9a0e963de4c6
I'm hiring! viz / ux / dev role in London https://thomsonreuters.wd5.myworkdayjobs.com/External_Career_Site/job/GBR-London-30-South-Colonnade/Data-Experience-Developer_JREQ109184
new Medium post https://medium.com/@briromer/what-i-learned-in-almost-30-days-of-codevember-9a0e963de4c6?source=friends_link&sk=ebd67bb49c4e2f0b06f3652658d71913
that's the "friend link" - new to me - when they feature something and paywall it, so you can non-paywall-share it with friends. I think they're finally figuring out monetization
We're hiring in our Lab just outside of Zurich: data science team seeking UXer to research, workshop, prototype and test innovative data-driven interfaces. Job link below, hit me up if you want more details
https://jobs.thomsonreuters.com/ShowJob/Id/190150/UX-Designer/
https://jobs.thomsonreuters.com/ShowJob/Id/190150/UX-Designer/
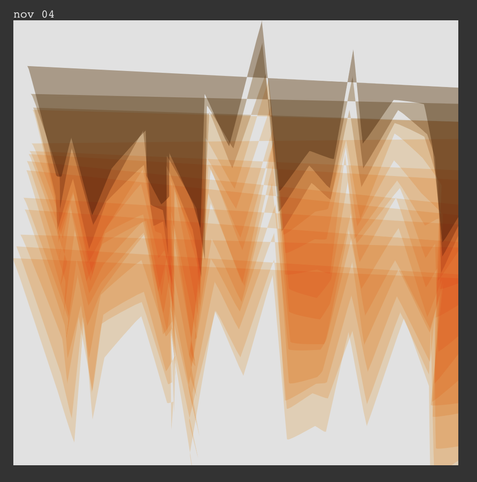
#codevember the 4th with p5js
anyone else doing codevember? first time for me and a chance to learn p5.js https://briromer.github.io/codevember2018/nov01/
WIP
@madeleine so yes this is an internal audience thing, and to your point is barely explained by the graphic. DS/UX clusters are locations of people who work in the same office, each of which has a team lead. originally we had the team leads networked in the middle with teams on the outside, but then flipped it so teams are closer with swappable talent. attached is a dark AND colorblind safe version
@matth wow that looks like just about the best js library for graphing I've seen
https://ialab.it.monash.edu/webcola/
I remember trying to use a CoLa plugin for CytoScape but it didn't work as well as I'd hoped. For fine-tuning graph layout Gephi has been my best option. from there you can export x,y, and meta from nodes and edges to use in d3/other
https://ialab.it.monash.edu/webcola/
I remember trying to use a CoLa plugin for CytoScape but it didn't work as well as I'd hoped. For fine-tuning graph layout Gephi has been my best option. from there you can export x,y, and meta from nodes and edges to use in d3/other

