RE: https://wisskomm.social/@Prof_Thielen/116018573516291035
Scheinbar sind wir live 😃
Researcher in visual computing. Professor at #HochschuleWorms University of Applied Sciences, #UXVis group, #ZFT center.
Previously (2018-04–2025-03) known as @aw @vis.social
| University | https://www.hs-worms.de/en/wiebel |
| UX-Vis | https://www.hs-worms.de/en/ux-vis |
| Personal | http://research.awmw.org/ |
| OpenWalnut | https://openwalnut.org/ |
RE: https://wisskomm.social/@Prof_Thielen/116018573516291035
Scheinbar sind wir live 😃
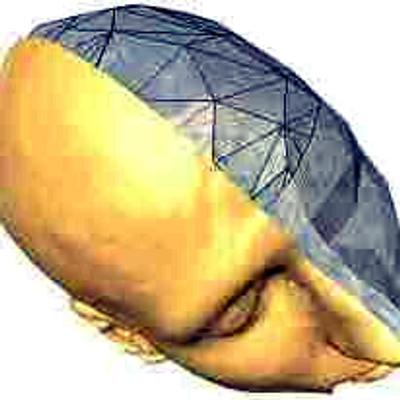
There are a lot of striking examples of bad and misleading visualizations out there. Even specific websites dedicated to the topic can be found. Yet, most of them only discuss charts and maps. Examples for bad 3D visualizations of spatial data (medical, flow, engineering, biological, climate, wheater, ...) are really hard to find.
Does anyone know of a good source for those?
#visualization #scivis #ieeevis #eurovis #dataviz #flowvis #biovis #medvis

We have been trying to replace coders with some technology since at least COBOL.
https://www.commitstrip.com/en/2016/08/25/a-very-comprehensive-and-precise-spec/

🎉 Our #SciVisContest contribution won the "Most innovative approach" award at #IEEEVIS in Vienna. You can find it here https://doi.org/10.5281/zenodo.17501787. And the video is here: https://forschung.awmw.org/Video/IEEE_SciVisContest_2025/ScrapMetalExplorer.mp4
Many thanks to the organizers of the contest.


We are looking forward to present "Scrap Metal Explorer", our contribution to the #SciVisContest, on Sunday at #IEEEVIS in Vienna. We will also have a Poster on our contribution.
See you in Vienna!


 🇪🇺
🇪🇺