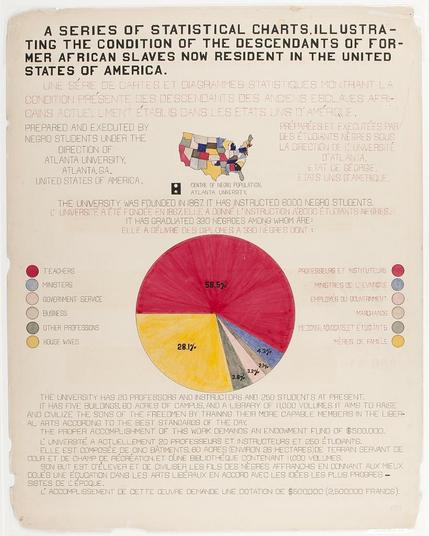
#DuboisChallenge2026, week 7: Serving as the introductory display, this chart shows the full Du Bois color palette. The chart includes bi-lingual text, a map of the Black population in the US, and a familiar pie chart showing professions in the population.