Aditya Jain

50 Followers
57 Following
50 Posts
Viz developer/designer
Websitehttp://www.sigri.com
Made a bad chart today. First arrow (from top) is 4 times as big as the last arrow. Nobody could interpret it that way ;_;
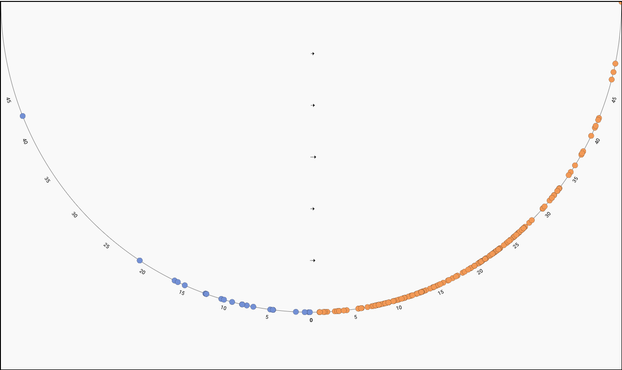
The horrific rapes in two Indian towns earlier this year motivated me to spend time in the annals of Indian crime records this past summer. I did so because I wanted to better my understanding of both the nature and scale of this epidemic. Along the way I've read dozens of articles in the mainstream media and obscure law blogs, filed a couple of RTIs and pieced together a visual essay which I'm sharing with you all today: https://adityajain15.github.io/Rape_In_India/
I've been working on visualizing the systematic dysfunction of the justice system that abets rape culture in India. I wanted to be as granular as possible so I'm using webGL here to depict each and every case of rape in the judicial pipeline during a calendar year (2016 in this instance). I'm hoping this particle sankey conveys just how broken the system is. I'd love to hear what you think (live demo at https://adityajain15.github.io/ncrb/)
Finally realized this thing I've been day-dreaming of for months. Its nowhere close to done but I'm so stoked
I'll be giving a talk at George Washington University about some work I did while I was at the Library of Congress. If you find yourself in DC or know someone who may be interested, please come! https://www.meetup.com/Data-Visualization-DC/events/251998703/
Southern Mosaic: Using Audio Data to Visualize a Nation

Wed, Jul 18, 2018, 6:30 PM: Seventy-nine years ago, on March[masked]: Two folk musicologists, husband and wife, John and Ruby Lomax, left their vacation home in Port Aransas, Texas to document musical