Colin Angus

277 Followers
61 Following
109 Posts
Public Health/Alcohol policy modeller @ University of Sheffield | Data botherer | Drawer of graphs | Writer of shoddy R code | Despoiler of cakes
GitHubhttps://github.com/VictimOfMaths
Twitterhttps://twitter.com/VictimOfMaths

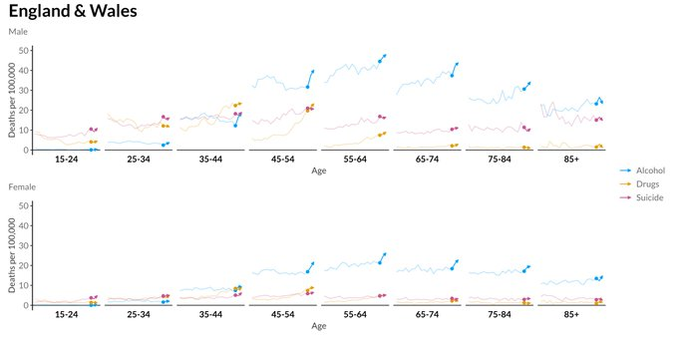
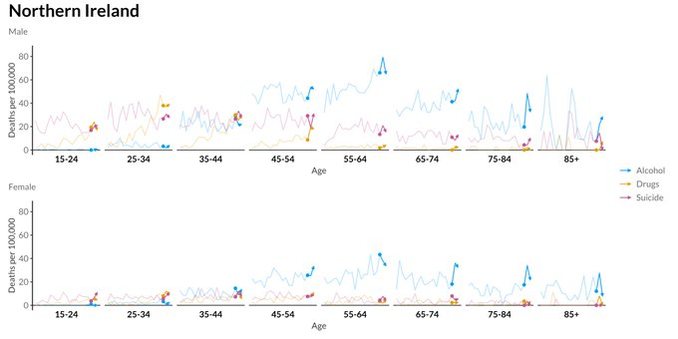
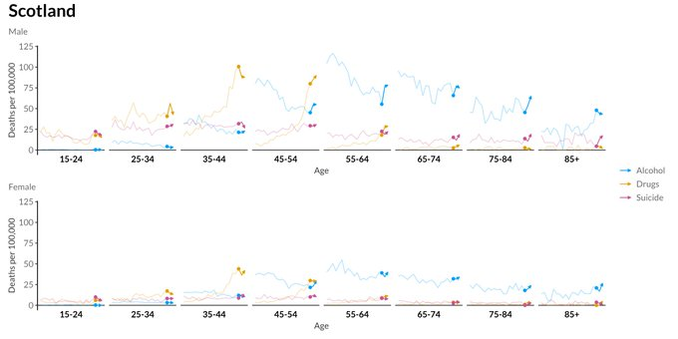
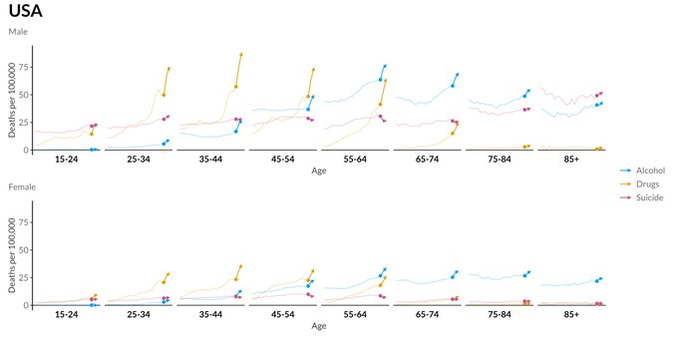
Following John Burn-Murdoch's excellent/horrifying thread on the other channel about premature mortality in the US, I wondered how much worse the picture was for young men specifically and how Scotland compared.

It turns out the answers are *much worse* and *not as bad, but not good either*.

Also, what's happening in Canada?

#RStats code for this plot is here: https://github.com/VictimOfMaths/Routine-Data/blob/master/HMDPlots.R

Routine-Data/HMDPlots.R at master · VictimOfMaths/Routine-Data

Plots and analysis of routinely published data. Contribute to VictimOfMaths/Routine-Data development by creating an account on GitHub.

GitHub

We also looked at age-specific trends. These tell some interesting stores about age differences in increased deaths.

In England the rise in alcohol deaths stands out across all ages, while in Scotland it's clearest in older ages (that had previously seen big falls), while drug deaths are still rising in older ages but falling in younger adults.

The US data, meanwhile, is just horrifying.

For drug-related deaths the picture is much less consistent. Scotland and the US have been on very similar alarming upward trajectories of drug deaths, as we've explored in a previous pre-print: https://doi.org/10.1101/2022.10.10.22280916

But while drug deaths in the US have accelerated even faster in the last 2 years, in Scotland the rise appears to have halted.

Alcohol deaths showed a similarly coherent, but less encouraging pattern, rising everywhere in 2020. There was, however, some variation in the scale of these rises. US numbers have risen starkly, while England & Wales have seen the biggest relative increase in the UK, but remain some way below current levels in Scotland and Northern Ireland.
Among the interesting things we found were the fact that in spite of dire predictions at the start of the pandemic that we'd see a huge rise in deaths by suicide, these fears appear to have been misplaced. Suicide rates fell below the pre-pandemic trends everywhere except perhaps Northern Ireland (although as a smaller nation, their figures are noisier so harder to interpret).

We've got a new paper out comparing alcohol, drug and suicide mortality (so-called 'deaths of despair') in the USA and the UK nations during the first 2 years of the pandemic in Public Health.

https://doi.org/10.1016/j.puhe.2023.02.019

We used publicly available mortality data to calculate age-standardised mortality rates for each cause and country 2001-2021. The grey area represents the pandemic period.

Americans might want to look away now.

Deaths by vaccination status, England - Office for National Statistics

Age-standardised mortality rates for deaths involving coronavirus (COVID-19), non-COVID-19 deaths and all deaths by vaccination status, broken down by age group.

Why is this? In large part it's down tot he fact that poorer households spend a greater proportion of their outgoings on food and gas/electricity bills - which have seen some of the biggest increases in prices in the past year or so.
The differential impact of recent inflation in the UK across the income spectrum remains *horrible*. The lowest income households are experiencing inflation rates 4.6 percentage points higher than those on the highest incomes.

Here's a map of the number of pubs and bars per capita for every Local Authority in Great Britain, based on data from OpenStreetMap.

Derbyshire Dales is the winner/loser (depending on your perspective) with one pub/bar for every 731 inhabitants.

#RStats code here: https://github.com/VictimOfMaths/Maps/blob/master/OSMGlobalBars.R

Maps/OSMGlobalBars.R at master · VictimOfMaths/Maps

Maps of stuff. Contribute to VictimOfMaths/Maps development by creating an account on GitHub.

GitHub