Patrick Stotz

534 Followers
170 Following
106 Posts
💼Co-lead data journalism & graphics at DER SPIEGEL
🗺️ Blogging about maps at letsmakeamap.com
workhttps://www.spiegel.de/duv
blog / map shophttp://letsmakeamap.com
One benefit of this hobby: you've always got a personal birthday gift at your fingertips.
Let's make some colorful maps this time

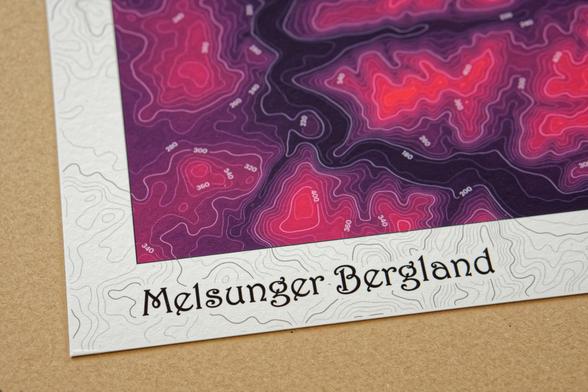
My figure-ground posters are also available for download on my blog. Just €8 per city/poster. Get yours, print it, frame it, use it as a wallpaper, whatever you like. 🗺️

https://www.letsmakeamap.com/maps/buildings-of-x

Buildings of X - Beautiful figure-ground diagrams for cities worldwide. — Let's make a map

Individually designed map posters of Amsterdam, New York, Beijing and many cities more available in the shop for download.

Let's make a map

@datawrapper Since ternary plots are hard to read, we explain them step by step in a scrollytelling.

Here's our article (🎁 free to read for the first 10 visitors)
https://www.spiegel.de/auto/mobilitaet-weltweit-beliebteste-verkehrsmittel-in-61-laendern-im-vergleich-a-99860da0-4d96-4505-bb78-3bd6a7674185?giftToken=22f9f1fb-704d-4d56-a2fc-f1ca9ee49e28

And here's the source data + the inspiration for the ternary plot:
vis.csh.ac.at/citiesmoving/

Die beliebtesten Verkehrsmittel weltweit: Wo das Auto dominiert – und wo das Fahrrad

Wie kommen die Menschen morgens zur Arbeit, mit Fahrrad, Bahn oder Auto? Wissenschaftler haben dazu Daten aus knapp 800 Städten in 61 Ländern zusammengetragen. Besonders facettenreich sind die Ergebnisse in Europa.

DER SPIEGEL
@datawrapper In case you want to do so too: The plot area is drawn with custom lines in this style. The position of each point is calculated in R with the TernaryCoords function from the Ternary package.

What's the dominant mode of transportation in cities worldwide?

First time for me, making ternary plots. Glad you can hack @datawrapper scatter plots in almost endless ways. #dataviz

How do AI models get their worldview?

We had the pleasure to visualize the investigation of @jer and @christo_buschek on the LAION-5B data set this week and built a 3D model of 5.8 billion books pages, filling roughly 58 large libraries.

https://www.spiegel.de/netzwelt/web/laion-5b-so-entsteht-das-weltbild-einer-kuenstlichen-intelligenz-a-dea0157b-d364-4622-8d77-3a1cb6c4afd1?giftToken=51315478-80cd-4150-8d4c-b24173b86ae8

Analyse von 5,8 Milliarden Trainingsdaten: Wie das Weltbild einer künstlichen Intelligenz entsteht

Mit welchen Bildern lernt eine KI, woher stammen sie? Wer entscheidet, ob sie geeignet sind? Forscher haben einen der größten Trainingsdatensätze untersucht. Wir machen ihre Erkenntnisse verständlich.

DER SPIEGEL
Great variation of the usual temperature/climate curves by @sdbernard for FT:
https://www.ft.com/content/8a436da0-0531-4561-b6f8-35fcd79b6d79
#dataviz
Warmer, wetter, hotter, drier — February caps unending stretch of record temperatures

Global average temperature rise in February reaches 1.77C above pre-industrial levels

Fires started heavily early in the season and are still raging. Normally they cease at this time of the year.
Attribution studies say, they became more likely due to climate change. Look at our temperature anomaly map from May-July.
#ddj #dataviz
Visualizing the devastating size of #Canada's #wildfires.
- Larger than the sum of 2018-2022
- As big as three mayor German states
- Larger than all of Germany's forests
- 3,5x the maximum of any year between 2014-2022
- 2x the size of the 1989 records