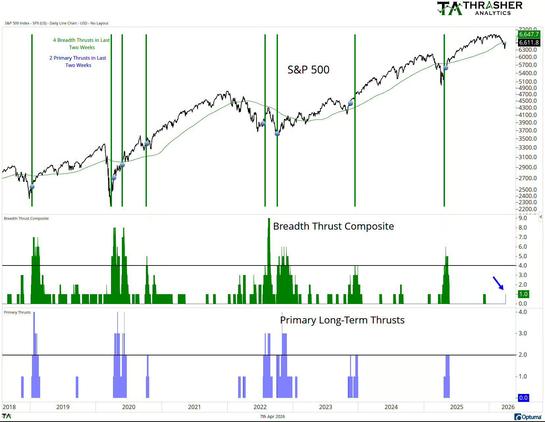
4 breadth thrusts and 2 primary long-term thrusts in two weeks (Thrasher Analytics). These signals have historically fired near market turning points. Getting a cluster this dense while headlines are maximally bearish is exactly the kind of setup contrarians look for.
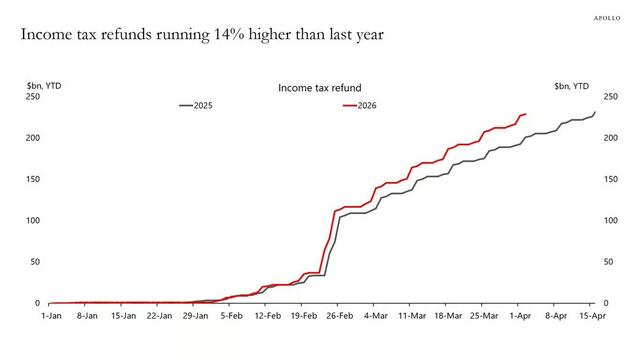
Income tax refunds are running 14% above last year's pace - about $15-20B more cash in consumer hands than at this point in 2025. Amid all the macro bearishness, this is one tailwind that's largely been ignored. Consumer spending data in Q2 will reflect it.
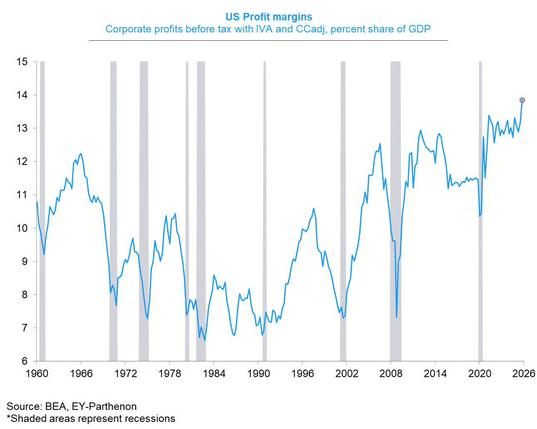
US corporate profit margins are near 14% of GDP - the highest in 65 years. Every prior peak at this level has been followed by a recession. Either the cycle has structurally changed, or we're in the late innings. The chart doesn't say which. It does say pay attention.
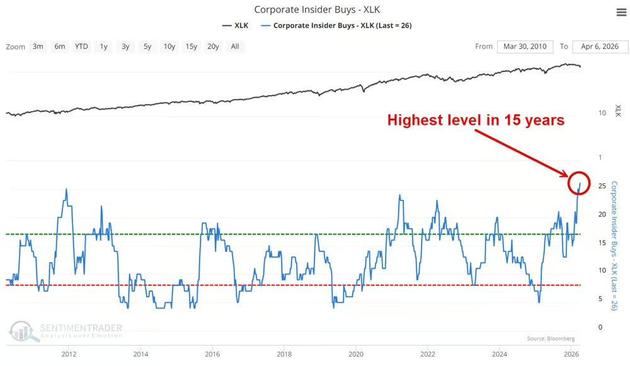
Corporate insiders are buying tech stocks at the highest rate in 15 years. 26 XLK insider purchases - nearly double the historical average. While the crowd is selling tech, the people who know these businesses best are buying. Someone is wrong about what comes next.
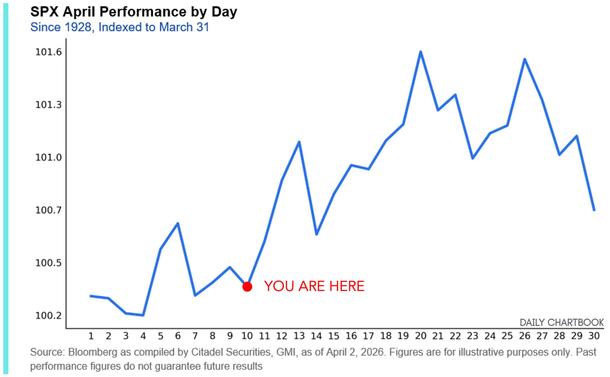
98 years of April data: day 10 is historically the low point of the month before a mid-April rally. The red dot on this chart says YOU ARE HERE. Seasonality isn't a guarantee - but it's one more signal pointing the same direction right now.
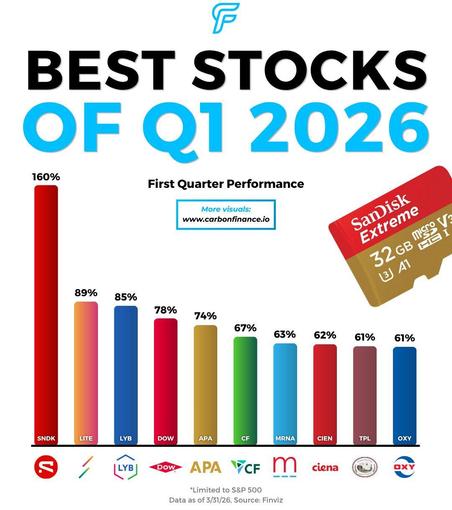
Best S&P 500 stocks of Q1 2026: SNDK +160%, LYB +85%, DOW +78%, APA +74%, HES +63%, OXY +61%. Outside of SNDK, the entire top 10 is energy and materials. The market rotated hard from tech into the physical economy this quarter.
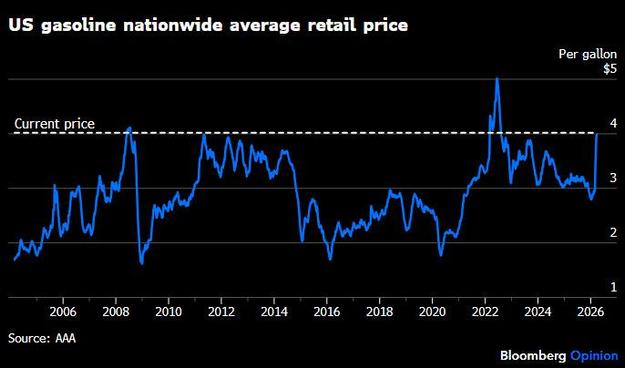
US gas prices are back at $4 per gallon. The last two times we were here: the 2008 oil spike and the 2022 Ukraine War energy crisis. $4 gas changes consumer behavior, drives inflation expectations higher, and complicates the Fed's job.
Every S&P 500 bear market since 1950 hit -5% in an average of 14.5 trading days. The current pullback took 35 days to get there. Bears are fast. Corrections are slow. The pace of this decline looks a lot more like the latter.
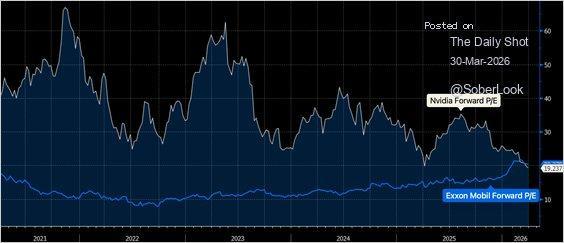
NVIDIA's forward P/E has collapsed to 19.24x. ExxonMobil's is ~13x. Two years ago that gap was 45+ points. The AI valuation premium has been almost entirely erased. Whatever NVDA does next has to come from earnings, not multiple expansion.
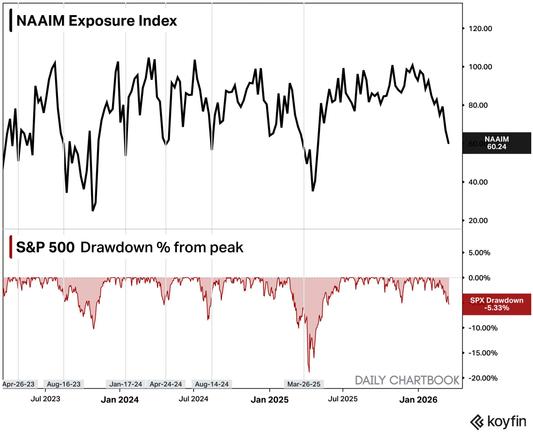
Active equity managers (NAAIM) are at just 60% exposure with the S&P only down 5.33% from peak. They've been reducing for months - well before the drawdown deepened. Professional positioning moved first. Price action followed.