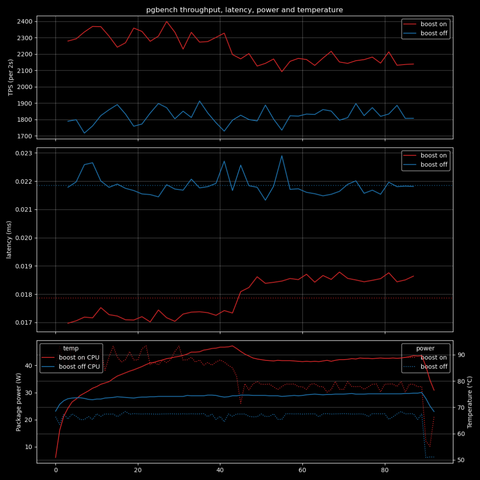
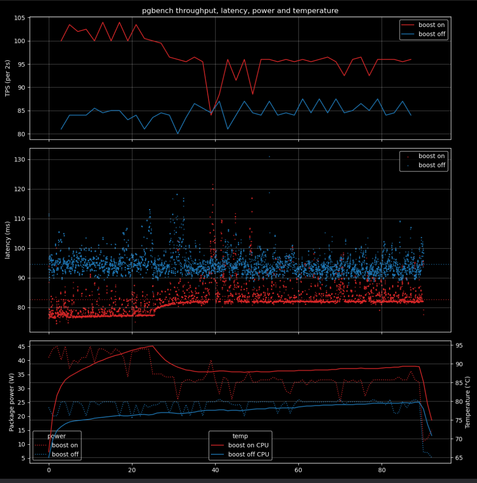
@AndresFreundTec

6.5K Followers
80 Following
414 Posts

Long time postgres developer, working at Microsoft.

Account about tech, not politics. For the latter look to @AndresFreundPol

Blueskyhttps://bsky.app/profile/anarazel.de

“Floating-Point Printing and Parsing Can Be Simple And Fast”

The fastest known floating-point printer and parsing algorithms - fixed-width printing, shortest-width printing, and parsing, all in 400 lines of Go.

https://research.swtch.com/fp
https://research.swtch.com/fp-proof

research!rsc: Floating-Point Printing and Parsing Can Be Simple And Fast (Floating Point Formatting, Part 3)

If you work on postgres or work intensively with postgres, you should consider submitting a talk to this year's pgconf.dev - the CFP deadline closes tomorrow! It's by far my favorite conference of the year!

https://2026.pgconf.dev/cfp

That experience has stopped me from making some terrible UX choices over the years (although I still have committed plenty UI crimes).

Got my start into making money with computers helping seniors learn computers. To this day I remember trying and failing to give a short & coherent explanation of when to use single clicks and when double clicks in Windows (must have been 98 and XP), File Explorer and Browsers. And the despair of the seniors not understanding..

Never really could come up with something that was better than "you should intuitively know".

Hoped for effect of AI use of new postgres contributors: Faster rampup, higher quality patches.

Real effect: A torrent of pointless patches, which often don't even pass tests. A torrent of AI generated pointless review comments.

I'm always hyping perfetto, because it's *really really* cool! Lalit does amazing work and has been super helpful sharing his knowledge on both how to do things in perfetto and even how to add features to the code for things I found missing. So it's great to see his post about his presentation from the Tracing Summit.

One neat thing in the talk is the examples show how perfetto can also ingest and visualize perf and trace-cmd output if those tools for capturing data are more familiar then perfetto's own!

https://lalitm.com/perfetto-swiss-army-knife/

Perfetto: Swiss Army Knife for Linux Client Tracing

Discussed on lobste.rs and Hacker News. I gave a talk at the 2025 Tracing Summit last month titled “Perfetto: The Swiss Army Knife of Linux Client/Embedded Tracing”. My goal in this talk was to show how Linux kernel, systems and embedded developers can use Perfetto when debugging and root-causing performance issues in their respective domains. Even though the Perfetto UI is primarily built for viewing Android or Chrome traces, it is a flexible tool and can be used in many other ways! The talk was recorded and is available on YouTube. Taking inspiration from Simon Willison, this post is an annotated presentation containing my slides and detailed notes on them. The talk also has a lot of UI demos: for these, I’ll have a screenshot but also a link to the relevant part of the video (videos are unbeatable for UI!). First, what is Perfetto? Perfetto is fundamentally a suite of tools: it’s not just one thing but a bunch of different tools working together to help you debug and root-cause problems. This diagram shows how everything fits together, with the core parts of the Perfetto project in the center. The recording tools for Perfetto consist of 1) an SDK for C++ apps 2) a daemon that can collect data from ftrace, /proc, /sys, and various kernel interfaces 3) another daemon that amalgamates trace data from multiple processes into a single trace file. These tools all speak the Perfetto protobuf format, a high-performance trace format designed to be very efficient to write but not to analyze or consume directly. That’s where the trace processor comes in. It’s a C++ library that parses the protobuf format, but also a bunch of other widely used trace formats. It exposes this data via an SQL query interface to any embedding program including Perfetto UI (which is what most of this talk is about) and also to the Python API if you want to do ad-hoc scripting or analysis in Python. There are also very common tracing/profiling formats used by the Linux community: perf.data, ftrace text format, Firefox profiler format, and many others. Perfetto supports quite a few of those directly. There’s also the Chrome JSON format (AKA the Trace Event Format) which is a simpler interchange format. It’s not the most efficient to read or write, but it does the job for a lot of use cases. Often people write converters. They have their own tracing format, maybe proprietary, maybe open source but something we don’t know about, and it’s very common that people convert to one of the formats we understand, most commonly our protobuf or Chrome JSON formats. The Perfetto UI is fundamentally a web-based trace visualizer, combining timeline visualization, user-driven selection/aggregation, and SQL queries all in one interface. Because it has the trace processor as a backend, it works with a bunch of different trace formats. It’s very important to note that even though the Perfetto UI is web-based, everything happens inside your browser and trace data never leaves your system. You can even build it and host it yourself on any static server: we’ve made it extremely easy to do so! At the start of 2025, we actually moved our whole development to GitHub. In the past, we used to develop on Android and GitHub was just a mirror. That’s no longer the case, GitHub is actually where we develop and take pull requests. Most of this talk, I’m going to spend actually showing you how you can use the Perfetto UI to debug performance issues on Linux. I don’t want to show you an Android trace which needs a lot of context about how the Android system works and so you think, “oh, that was cool, but I didn’t really understand what was happening.” So to make this talk more approachable, I wrote a straightforward demo program you can look at yourself! So it’s obviously not a production system but I’ve tried to make it as representative of the sort of issues we use Perfetto for every day. It’s a Rust program which generates a Julia set and visualizes it over time. The technologies I used: Vulkan, GPU rendering and also multi-threaded CPU computation. So how it works is that computation of various parameters is happening on background threads, and then that’s being passed to the main thread for rendering. And then, for demonstration purposes, there is a performance bug; rendering should run at 60 FPS, but every so often, the frame rate drops dramatically. Here’s what that looks like: The code is on GitHub and if you’re interested in following along. The traces are there as well - you don’t have to collect the traces yourself, but you can if you want. All the instructions and information is in the README. So the first suspicion we may have is that maybe it’s some CPU problem. A lot of engineers I know would reach for perf immediately whenever they see a problem like this. The main reason is that if perf can capture the problem, they can go straight to the line of code without needing to spend time debugging using more complex approaches.

Lalit Maganti

A few folks at @pgconfeu suggested I should have a public list of changes to postgres that I'd like to see happen, but am not planning to work on in the near term.

Started doing that:
https://wiki.postgresql.org/wiki/User:Andresfreund/Desired_Changes

User:Andresfreund/Desired Changes - PostgreSQL wiki

I'll give a talk about "AIO in Postgres 18 and beyond" at @pgconfeu in a short while. The slides are at:
https://anarazel.de/talks/2025-10-23-pgconf-eu-aio-in-PG-18-and-beyond/aio-in-PG-18-and-beyond.pdf
Broken memory barrier intrinsics are scary and hard to debug.
@tmunro found one in clang / llvm...
https://github.com/llvm/llvm-project/issues/164194#issuecomment-3424208562
RISCV fence and load order broken when function inlined twice · Issue #164194 · llvm/llvm-project

struct PgAioHandle { char x; int y; }; static inline bool f(struct PgAioHandle *ioh, int y, char *x) { *x = ioh->x; __atomic_thread_fence(__ATOMIC_ACQUIRE); if (ioh->y != y) return false; return tr...

GitHub
For sake of my power bill and, at least as important, the room temperature, I do enable power-saving when not running benchmarks...