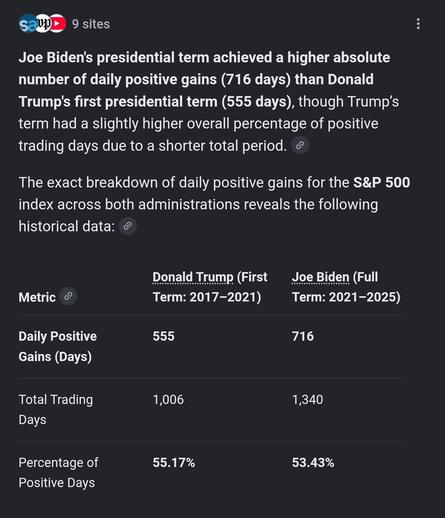
#JoeBiden
#POTUS
#CNBC
#Squawkbox
#premarket
#investing
This doesn't look right. How was trading days during Biden's term nearly a whole year longer?
COVID is my first guess.
It's a good question for analysis. Run with it.
What is the source for this table?
Google inquiry.
I think Google was still counting days past January 20, 2025 for Biden's term.
RE: https://social.sdf.org/@jchaven/114889457441529560
@jchaven
I believe this is the reference that was used to explain the total trading day gap.
"Donald Trump's first term maintained a highly consistent, steady climb fueled by low interest rates and the 2017 corporate tax cuts. However, his positive day count was heavily disrupted during the final year by the massive market corrections brought on by the Q1 2020 #COVID-19 pandemic."
One of the 9 sources include
https://smartasset.com/investing/stock-market-trump-vs-biden
Markets didn't close during Covid.
Total calendar days for each term: 1,461
Federal "Work" days for January 20, 2021, to January 20, 2025 = 987
1461 calendar days - 474 days skipped:
Excluded 209 Saturdays
Excluded 209 Sundays
Excluded 56 holidays
Federal "Work" days for January 20, 2017, to January 20, 2021 = 989
1461 calendar days - 472 days skipped:
Excluded 209 Saturdays
Excluded 209 Sundays
Excluded 54 holidays
Even taking "hours" into account the terms had similar trading days.
Trump (Jan 20, 2017-Jan 20, 2021):
Total trading days: 1,006
Normal full-length days: 1,000
Early-close days: 6
Cumulative regular-session trading hours: 6,517 hours
Biden (Jan 20, 2021-Jan 20, 2025):
Total trading days: 1,008
Normal full-length days: 1,002
Early-close days: 6
Cumulative regular-session trading hours: 6,522 hours
(Early-close days: each 3.0 hours if 1:00 PM close OR 5.5 hours if 2:00 PM close)
Results for S&P 500 daily closes (day counts as "positive" if close > previous trading-day close):
Trump first term: Jan 20, 2017-Jan 20, 2021
Trading days in range: 1,006
Positive (up) days: 525
Negative (down) days: 468
Unchanged days: 13
Up-day percentage: 52.2%
Biden term: Jan 20, 2021-Jan 20, 2025
Trading days in range: 1,008
Positive (up) days: 536
Negative (down) days: 456
Unchanged days: 16
Up-day percentage: 53.2%
Regardless of this information (market's performed better under Biden by about 1%), Biden still was a better president.
Trump is still a grifting narcissist that doesn't give a shit about anyone but, himself.
I believe the total day drops in market value in the final year of the first Trump Administration is considered an adjustment as the daily declines overwhelmed daily gains on the #bellcurve.