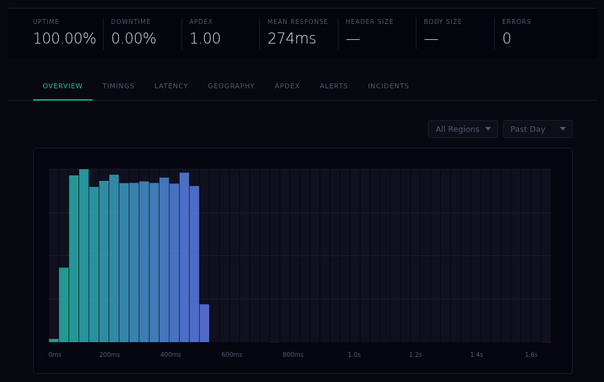
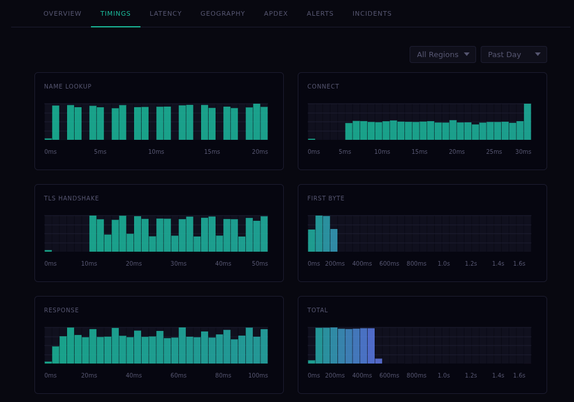
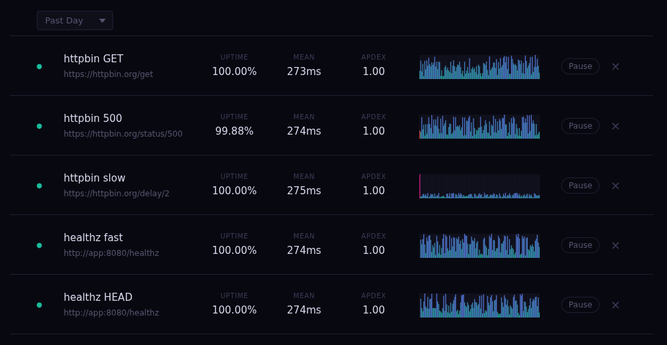
Now we have some Prometheus metrics being exported so we can keep an eye on the health of https://probes.dev

#GoLang #SQLite #Prometheus #Observability

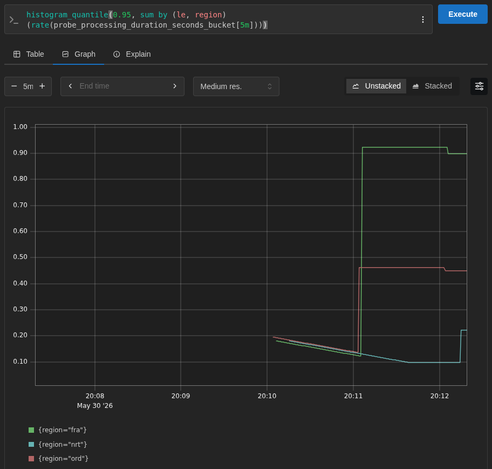
After running some load tests the current implementation will be able to handle 40,000 active probes.

#GoLang #SQLite #LoadTesting

Very pretty.
@blainsmith that's sexah. never saw a ui i literally wanted to eat ))
@jae Haha, thanks! We're really trying to not look like any of the other monitoring services, especially the VC-backed ones which look all the same.
@blainsmith yeah it stands out in a good way. just looking at the ui alone it seems like a product i would eval and use. why? it has useful data i care about, doesn't have gimmicky ui, or yet another grafana dashboard. it's driving my curiosity
@jae Yeah the point is to just watch your targets and alert you via email or webhook if it's down, slow, etc and then you can dig into timings. Period. No other BS. Especially for solo and small teams.