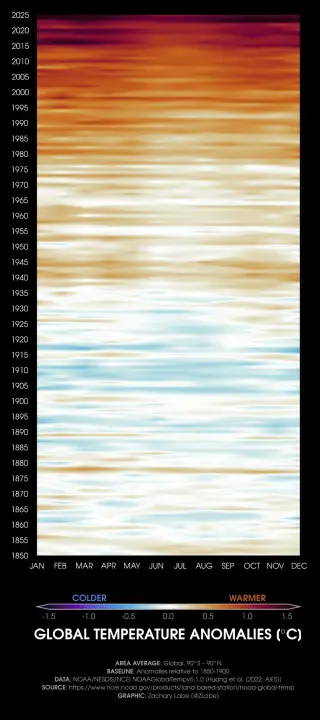
A timeline of our rapidly changing planet (through 2025)...

I've now added this visualization permanently to my climate change indicators webpage (at the bottom): https://zacklabe.com/climate-change-indicators/. Check it out there, as it looks much better in its full resolution!

Wetterstatistiken meiner Station – The Blog of DO3EET

Ich bin Frank. Ein Informatiker und Funkamateur aus Deutschland. Außerdem reise ich gern nach Japan.

@ZLabe The acceleration in the last 40-45 years (a picosecond in relation to the age of the earth) is notable and somewhat frightening too.
@ZLabe instead of slowing down (or even stopping) the warming we seem to be accelerating it ... well done US, china, saudis, russia, canada, uae ... and these Fing fossil fuel and AI companies who have bought our politicians
@ZLabe I had heard that the arctic was warming 4 times faster than most other places on the globe. Any speculation why antarctica is about ½ southern polar regions?
@ottominati @ZLabe The difference in sensitivity between the arctic and Antarctic is one is underlain by ocean and the other is continental. So the melting ice and warming ocean has a larger runaway effect.
@ZLabe I saw this chart scrolling up, so it's looking blue and white, that's fine, scroll up, a little bit of orange, ok. Scroll up, oh, oh no.
@ZLabe Legend has it that in 2000 years time, it will be a portrait of Rick Astley