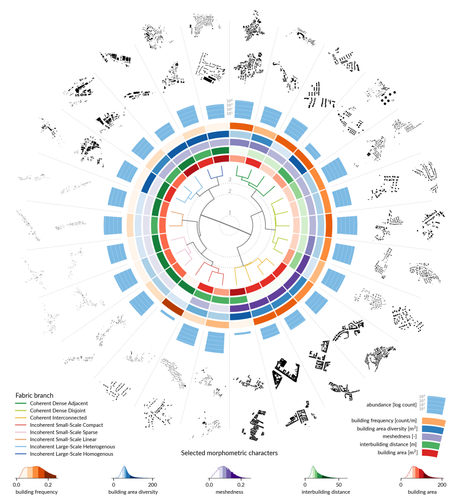
We have a new paper out! Named "The hierarchical morphotope classification: A theory-driven framework for large-scale analysis of built form”, it provides an overview of the method we used to build our Urban Taxonomy dataset.

https://authors.elsevier.com/sd/article/S0264-2751(26)00279-9

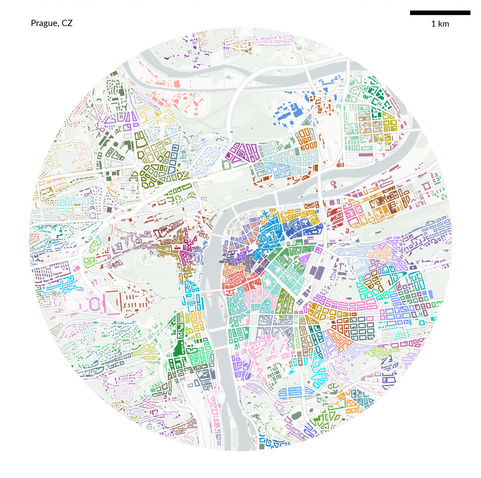
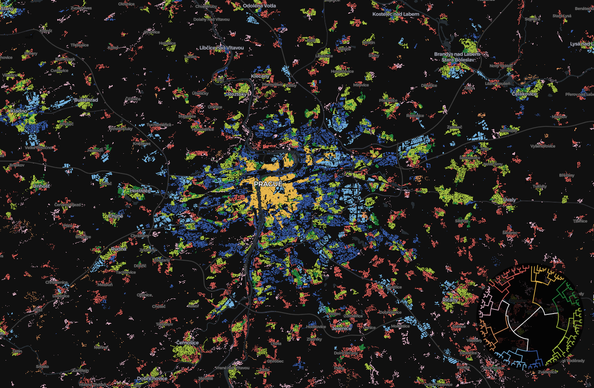
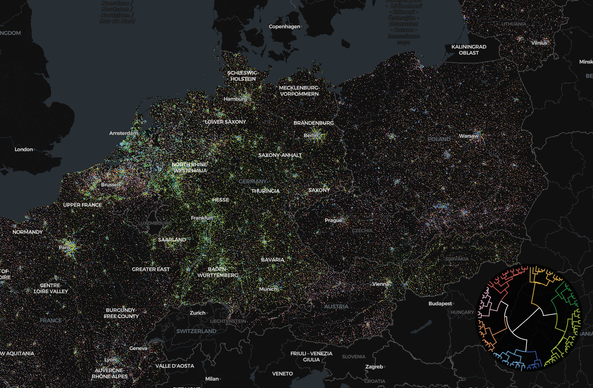
Morphology often hits scalability limits. This method is able to break those as shown by classifying over 90 million buildings (in the paper, we have 150 million + now).

1/n

At the same time, the “data-driven" nature of quantitative methods tends to be disjoint from morphological theory.

We took concepts known from 80s and re-conceptualised them for urban morphometrics. This leads to identification of "morphotopes" (as biotopes), the smallest morphologically homogeneous regions.

And because there's a lot of them, we have organised them into a taxonomy.

2/n

Though papers are boring, so we have something fun for you - a map. If you head to https://urbantaxonomy.org, there's a beautiful interactive map of the resulting taxonomy waiting for you. Just a piece of warning - it can suck a lot of time!

3/n

One aspect I am really proud of is hidden in the Data availability statement - “The SA3 functionality has been contributed to the open source package spopt, morphometric assessment to momepy, and features required to support those to libpysal, shapely and geopandas.”

We have not only published our research code openly but made sure the relevant pieces have been contributed upstream. So big thanks not only to co-authors but to a wider community!

4/4