Some perspective.
@jaykuo
Couldn't really fit a fuller description of the chart in only one post; I'd rather have the second sentence of my alt text be:
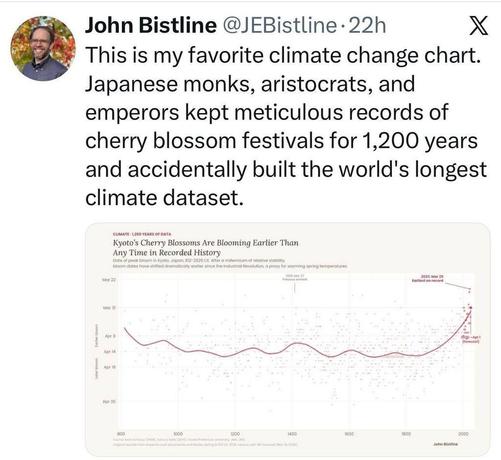
The trend in dates is shown to have varied sooner and later in waves before, but has trended sooner steadily since the mid-1800s to exceed any previous peak, in defiance of the old pattern.