Three charts based on #CopernicusAtmosphere data you shouldn’t miss this month:
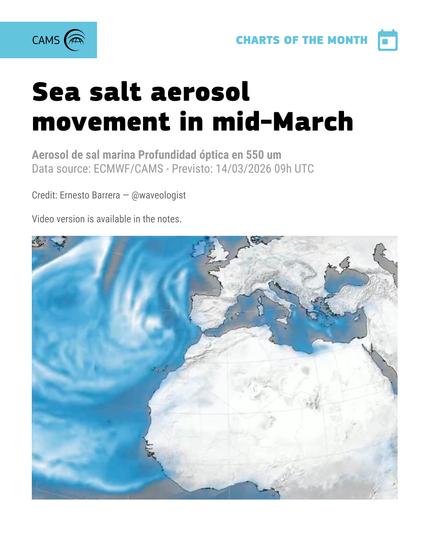
📈 Global sea salt aerosol – Ernesto Barrera
1️⃣ https://x.com/waveologist/status/2033537352874778836
⬇️
Three charts based on #CopernicusAtmosphere data you shouldn’t miss this month:
📈 Global sea salt aerosol – Ernesto Barrera
1️⃣ https://x.com/waveologist/status/2033537352874778836
⬇️
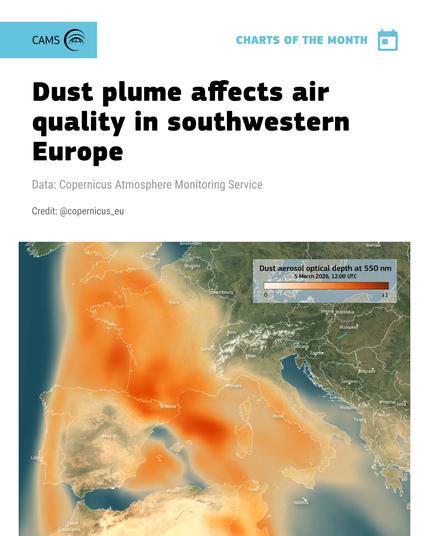
📈 Massive plume of Saharan dust travelling across Europe in early March – CAMS
2️⃣ https://www.instagram.com/p/DVizp3gDF_J/
See the Copernicus #ImageOfTheDay: https://www.copernicus.eu/en/media/image-day-gallery/saharan-dust-plume-spreads-across-european-skies
⬇️
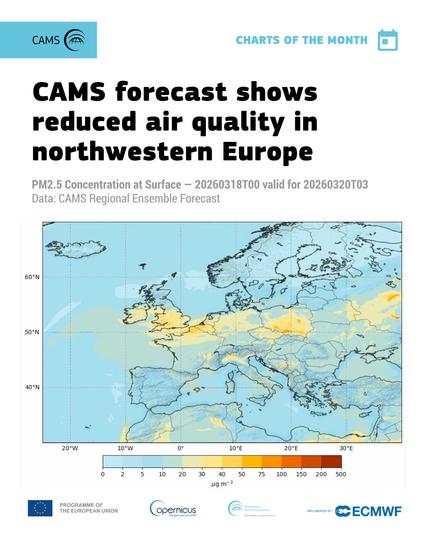
📈 Seasonal increase in ground level concentrations of PM2.5 across NW Europe – CAMS
3️⃣ https://bsky.app/profile/copernicusecmwf.bsky.social/post/3mhds53adkk2h
Explore the forecast:
https://atmosphere.copernicus.eu/charts/packages/cams_air_quality/products/europe-air-quality-forecast-regulated
⬇️
Learn more about our charts page:
https://atmosphere.copernicus.eu/guide-cams-visual-products-our-atmosphere-your-fingertips
Get the data:
https://atmosphere.copernicus.eu/data
Explore the CAMS Methane Hotspot Explorer:
https://apps.atmosphere.copernicus.eu/methane-explorer
The Copernicus Atmosphere Monitoring Service (CAMS) provides free and ready-to-use charts based on its global and European forecasts, allowing everyone to monitor our atmosphere in near-real time and foresee its evolution. Here is an overview of the features included in our charts.