@recollir I'm sure its possible to do with gnuplot too, the issues are rather the standard ones: time, energy and figuring out how to do it...

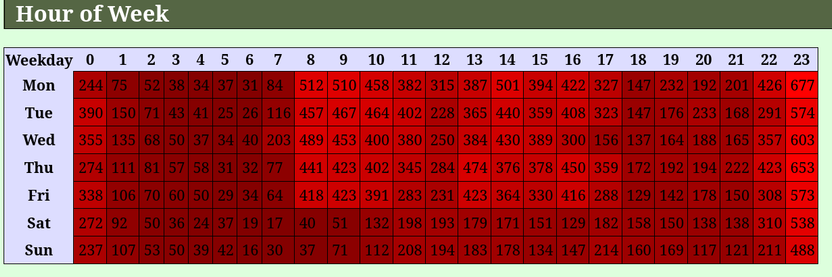
@bagder Maybe something like this... Based of https://curl.se/docs/releases.csv

Not double checked (yet) the awk, date scripts to generate the input for gnu plot. And the gnu plot script is neither presentable yet. But it seems to work.

@recollir that looks beautiful!
@bagder It took some time. I will tinker on it in the background and then share when it is presentable. I could create an issue on GH if you are interested the. There would be a better reference then.
@recollir I'm super interested!

@bagder there is now a gist with the gnuplot script at https://gist.github.com/recollir/8f3bcd6c91a482dc9a5b13b7fc823799

And an open issue for it at https://github.com/curl/stats/issues/28

Feel free to use it however you want.

Create GitHub styled heatmaps with gnuplot

Create GitHub styled heatmaps with gnuplot. GitHub Gist: instantly share code, notes, and snippets.

Gist
@recollir I could imagine trying to similar heatmaps for a few other things as well. Like this gitstats table for commits per hour over a week:

@bagder I guess this is UTC and that the night commits then happened for people in a more suitable time time zone. At least I hope.

I somehow saw that one could draw a “background” in gnuplot. I fill it with the gray squares. Then I overlay the data. Which has been put into four buckets for the values. Each bucket got a color assigned to it.