The World Meteorological Organization report on the State of the Global Climate 2025 was released today:

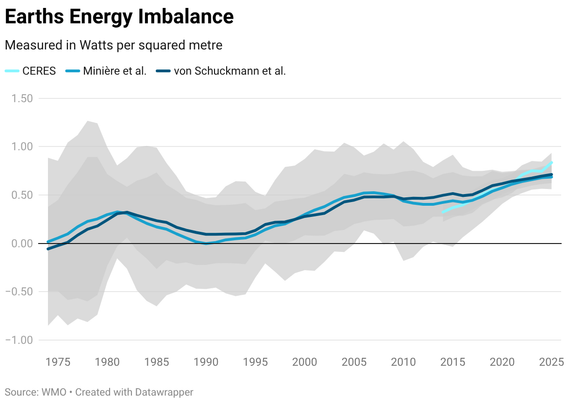
"Earth's energy imbalance has been growing since the 1960s, reaching a record high in 2025."

"Extreme weather impacts millions and costs billions."

Press release: https://wmo.int/news/media-centre/earths-climate-swings-increasingly-out-of-balance

@ZLabe Forgive me Zach, but it seems weird to post this graph without any indication of what the vertical axis represents, or why that quantity is important. I tried clicking through to the press release you linked, and the underlying Global Climate report page it links to, and the PDF that provides, but have not yet found this graph in those materials. Am I being dumb? I had hoped to reply to your toot with a summary explainer, for the benefit of other readers.
@ZLabe AHA! Page 20 of the PDF report, although it doesn't include that precise graph, it does include a similar one, and the page is dedicated to explaining what the new indicator "Earth's Energy Imbalance" means, and why we should care. I'll post again after digesting...

@tartley @ZLabe
The more netto heat is added to the system, the faster its temperature increases.

Main reason for the acceleration seems to be decreasing reflectivity by clouds. Very worrisome.

@tartley I am so sorry for not being more clear in this post! The sub-title shares the y-axis information, which is "Watts per squared metre." There is more information here as well: https://climatechangetracker.org/global-warming/monthly-earths-energy-imbalance
Monthly Earth's Energy Imbalance | Climate Change Tracker

Monthly Earth's Energy Imbalance: Discover the factors affecting Earth's energy balance and its relation to global warming.

@ZLabe no apologies necessary, I was just lost and confused, is all. I dug around until I figured it. Thank you for the post!
For curious drive-by readers like me, the
"Earth's Energy Imbalance" is a newly adopted eighth key indicator of the WMO's latest 2025 report. The imbalance is the rate of the Earth's net energy gain over time, i.e. the difference between incoming sunlight vs heat loss to space. In recent decades, this quantity has been increasingly positive, as human produced greenhouse gases cause heat to be trapped within the atmosphere, oceans, and landmasses of the planet. cc @ZLabe
@ZLabe This makes the energy imbalance a useful overview, summarizing other key indicators such as near-surface temperatures, ocean temperatures, and sea ice retreat, into a legible single value.