One hundred #curl graphs
https://daniel.haxx.se/blog/2026/03/15/one-hundred-curl-graphs/
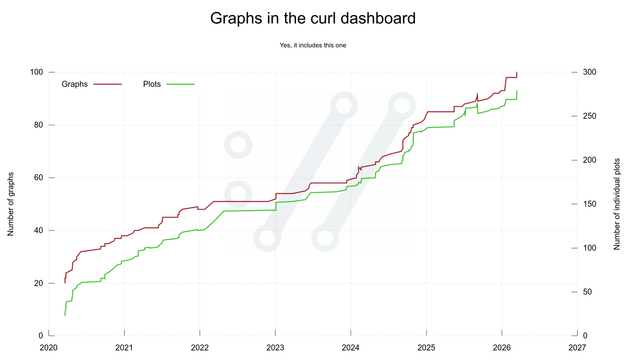
One hundred curl graphs
In the spring of 2020 I decided to finally do something about the lack of visualizations for how the curl project is performing, development wise. How does the line of code growth look like? How many command line options have we had over time and how many people have done more than 10 commits per … Continue reading One hundred curl graphs →