If you've been having trouble finding a tech job in the US over the past few years, here's some data to validate that it isn't just you.
@mawr that dip in 2020-2021 is when i was graduating college and that dip in 2023 was when i gave up and got a job at walmart ((:
@sierrashark I'm starting at a parcel service today. Wish me luck!
@mawr Tech is dead at the moment, no company hire juniors anymore. Same in Europe here too.

@doggo @mawr And it’s being sold as a good thing.

„We only hire senior developers” - of course you do!

@mawr Thinking about pivoting to something else because at this point even though I have 5 years of experience I don't think I will make it into a job.
@meluzzy I have 20 years of experience and I've given up on tech at this point.

@mawr

Yep. There are way, way more unemployed tech people than there are jobs available in big #tech companies or big companies with tech departments.

Laid off folks need a day job for the time being, while forming small companies to replace the enshittified big tech software with desktop, AI free, alternatives.

Some of us remember why we *ran* to PCs away from central servers (the cloud). Now you kids get to experience having your data held hostage & forced "downgrades."

Offer better.

@mawr Yeah.. Sadly, I'm not hoping for much better than my IT Support position for quite a while.. Not gonna complain though as I do L2 work which doesn't involve speaking to normal end users very often..I'm thankful for it at this moment..
@mawr got a source link? I'd like to send it to some folks
Joseph Politano (@josephpolitano)

The US tech sector continues losing jobs—overall, employment decreased by 8k last month and is down 45k over the last year That's not as bad as the worst of the 2024 tech-cession, but extremely bad compared to the 2022 boom or even pre-2020 norms

Substack
@mawr All the tech bros cheering for 'AI' to take their jobs
@mawr
Please explain graphs to me. How is the line going below zero?
@notyourfanboy reduction in available positions, vs increase.

@mawr
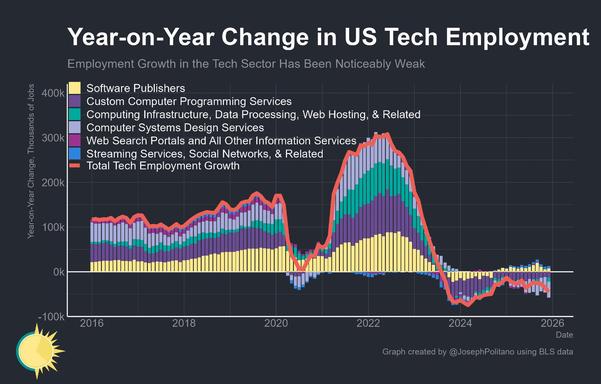
It also don't make any sense that each color isn't just a single point. Doesn't each category just represent a single number? How can steaming services for Jan 2024 have a range of values, for example?

Don't worry about trying to explain it, I doubt I'll be able to understand.

I believe that there are less tech jobs, in general.

Stacked Bar Charts: A Detailed Breakdown | Atlassian

Master stacked bar charts: visualize and compare subcategory data with ease in our comprehensive guide.

Atlassian
@mawr
😆 Ya, no help. Graphs are just beyond me I guess.
@mawr 😬 I'm not sure if I wanted to see that at this moment.
@mawr It’s absolutely awful out there and the difficulty of connecting with people hiring has also never been worse.
@mawr I think there's something wrong with the scale, it claims it's in "thousands of jobs", but tops at 400k. So that's 400k thousands of jobs, which would be 400 Million jobs... that seems excessive compared to the population of the US.
@casandro I think the thousands and k on the scale are meant to illustrate the same thing, which also tracks about right with my understanding of the market