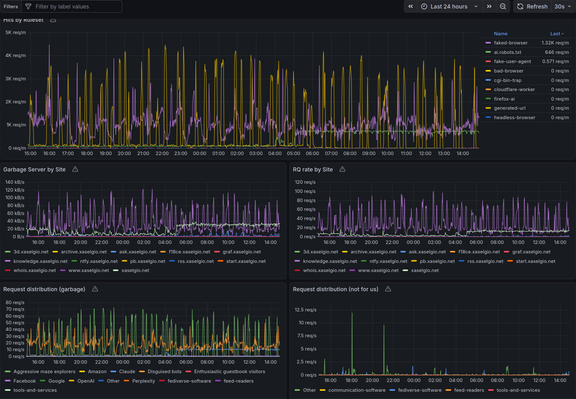
@avery I'm using grafana for the graphics.For monitoring, it's a mix of prometheus + various exporters, and telegraf.
grafana
prometheus
telegraf
You can find nice panels on grafana website, including for nginx!