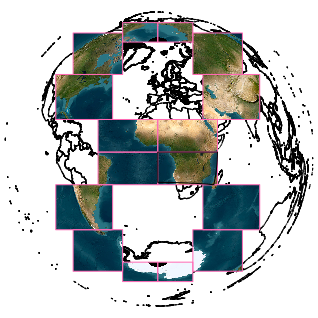
ah, you know sometimes you just do the work right and finally make the tool to just plot the thing you need ...

#yeahthat #RStats {geographiclib} ftw
p <- expand.grid(140:150, -45:-38)
plot(p)
maps::map(add = T)
text(p, lab = geographiclib::mgrs_fwd(as.matrix(p) * 1.0, precision = 0), pos = 1 )

ok so here's how I get Sentinel 2 assets, find the code you want 👆 - use hypertidy/sds::stacit() with *mgrs-code* OR xmin,xmax,ymin,ymax and whatever date/daterange: qu <- sds::stacit(c("55GDN"), "2026-02-27" ) then get the STAC montrosity and find the href: js <- jsonlite::fromJSON(qu)
> sprintf("/vsicurl/%s", js$features$assets$red$href)
#IKR
and, you might want a reduced resolution so let's go for overview 2 (full resolution == -1, first lower resolution level is 0, in this dataset 2 is 1373x1373 which is ceiling(10980 * 2^(-3)) )"vrt:///vsicurl/{url}?ovr=2" (seems like a good time to point out that terra::rast will automatically unscale S-2 ints to floating point, but not lower resolutions -just a fun gotcha in the gotcha-swamp)
and then you faafi with colour balance, and log_relative is my new best friend
and then more lesson-by-claude than is really proper and decent, but some nice results https://mdsumner.github.io/gdal-r-python/sentinel2_stretch.html
Contrast stretching for a Sentinel-2 scene