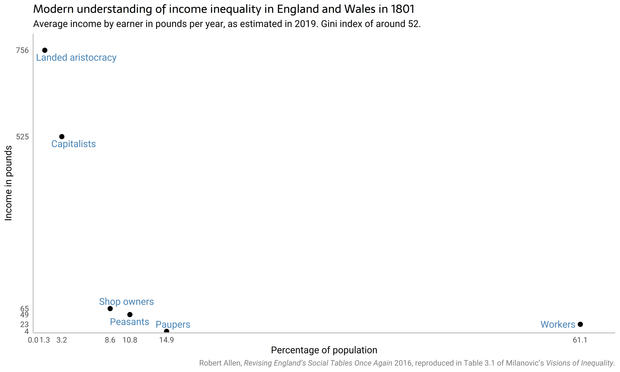
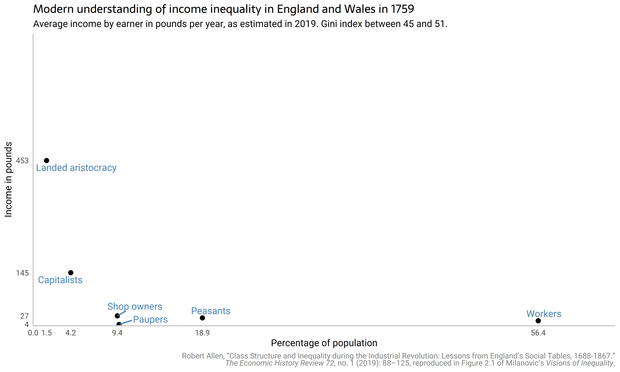
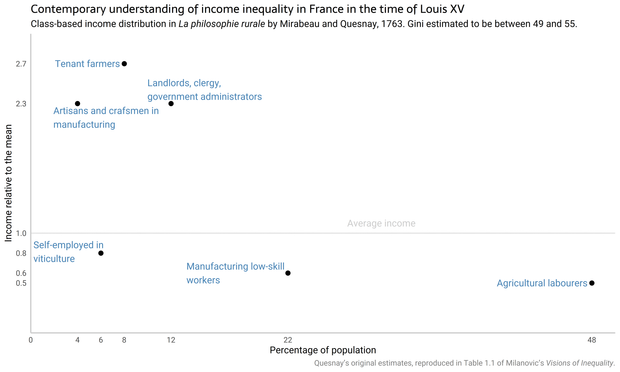
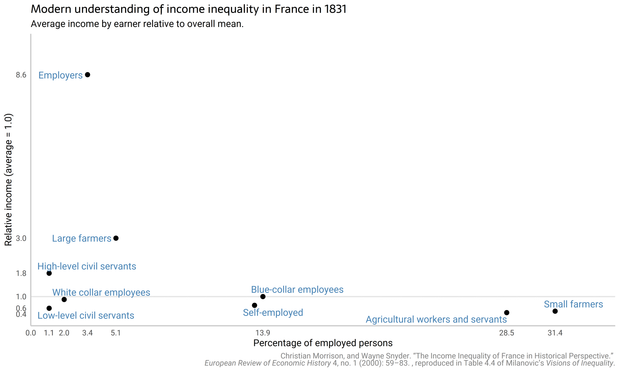
Scatter plots are cool! Inspired by Branko Milanovic's *Visions of Inequality* , I drew some as alternative ways of visualising historic social tables of income and population by class. Blog post, with #rstats code, at https://freerangestats.info/blog/2026/02/08/social-table-visualisations