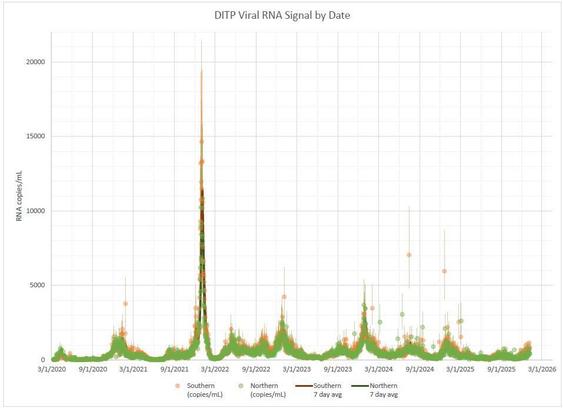
What are we to make of this graph? 1000 RNAs/ml is still a lot of circulating virus, but five years in, we're not seeing those spikes like we have every other winter since 2022. (Data in printed-out-spreadsheet form at https://www.mwra.com/media/file/mwradata20260112-datapdf). #COVID
Related: why do the Biobot and WastewaterSCAN numbers seem to be different, and what does that tell us about the reliability of the sample?
@wollman WastewaterSCAN normalizes in a different way, they have a description somewhere. Leads to a lot more weird spikes than MWRA-posted data.
@wollman cynically: "the new normal" :/

@wollman There hasn't been a big mutation recently, maybe? So may not be predictive.

Or, less plausibly people are eating more peppers (they use a pepper virus RNA in the wastewater to normalize the data).