ต้นไม้เมืองแต่ละต้นสามารถลด runoff เหมือนดูดเก็บกาแฟหนึ่งแก้วต่อวินาที (∼0.14 ลิตร/วินาที) และในพื้นที่ที่ศึกษานี้ คิดรวมทุกต้นจะลด peak discharge 17 ถึง 27%

Hydrological modeling is commonly used in urban areas for drainage design and to estimate pluvial flood hazards in order to mitigate flood risks and damages. In general, modelers choose well-known and proven models, which are tailored to represent the runoff generation of impervious areas and surface runoff. However, interception and other vegetation-related processes are usually simplified or neglected in models to predict pluvial flooding in urban areas. In this study, we test and calibrate the hydrological model LEAFlood (Landscape and vEgetAtion-dependent Flood model), which is based on the open source ‘Catchment Modeling Framework’ (CMF), tailored to represent hydrological processes related to vegetation and includes a 2D simulation of pluvial flooding in urban areas using landscape elements. The application of LEAFlood was carried out in Vauban, a district in Freiburg (Germany) with an area of ∼31 hectares, where an extensive hydrological measurement network is available. Two events were used for calibration (max intensity 17 mm/h and 28 mm/h) and validation (max intensity 25 mm/h and 14 mm/h), respectively. Moreover, the ability of the model to represent interception, as well as the influence of urban trees on the runoff, was analyzed. The comparison of observed and modeled data shows that the model is well-suited to represent interception and runoff generation processes. The site-specific contribution of each single tree, approximately corresponding to retaining one cup of coffee per second (∼0.14 L/s), is viewed as a tangible value that can be easily communicated to stakeholders. For the entire study area, all trees decrease the peak discharge by 17 to 27% for this magnitude of rainfall intensities. The model has the advantage that single landscape elements can be selected and evaluated regarding their natural contribution of soil and vegetation to flood regulating ecosystem services.
@kkavee The image is a screenshot of a scientific article titled "What Is the Contribution of Urban Trees to Mitigate Pluvial Flooding?" by Karina Sinai Medina Camarena, Thea Wübbelmann, and Kristian Förster. The article is published in the journal "Hydrology" by MDPI. The authors' affiliations are listed, with the first author from the Institute of Hydrology and Water Resources Management at Leibniz Universität Hannover, Germany, and the second author from the Climate Service Center Germany (GERICS) and the Institute of Physical Geography and Landscape Ecology at Leibniz Universität Hannover, Germany.
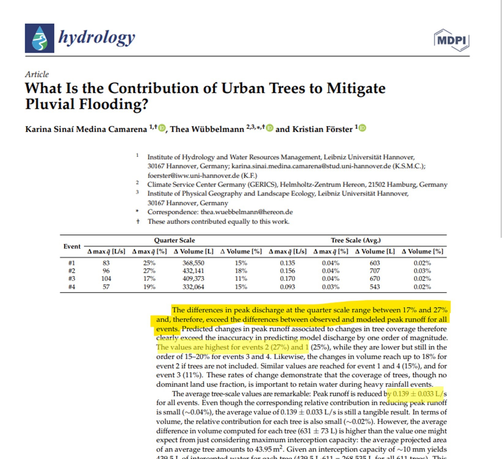
The article includes a table with data on peak discharge (A max [l/s]), quarter scale (A Quarter Scale [%]), volume (A Volume [%]), and tree scale (A Tree Scale [l]) for four events (#1 to #4). The table shows the differences in peak discharge and volume between observed and modeled values, with highlighted text emphasizing the differences in peak discharge at the quarter scale, which range between 17% and 27%.
The highlighted text in the image states: "The differences in peak discharge at the quarter scale range between 17% and 27% and, therefore, exceed the differences between observed and modeled peak runoff for all events. Predicted changes in peak runoff associated to changes in tree coverage therefore clearly exceed the inaccuracy of predicting model discharge by an order of magnitude. The values are highest for events 2 (27%) and 1 (25%), while they are lower but still in the order of 15–20% for events 3 and 4. Likewise, changes in volume reach up to 17% for event 2 if trees are not included. Similar values are reached for event 1 and 4 (15%), and for event 3 (11%). These rates of change demonstrate that the coverage of trees, though no dominant land use fraction, is important for reducing water during heavy rainfall events. The average tree-scale values are remarkable: Peak runoff is reduced by 0.139 ± 0.033 l/s for all events. Even though the corresponding contribution of reducing peak runoff is small (~0.04%), the average value of 0.139 ± 0.033 l/s is still a tangible result. In terms of volume, the relative contribution for each tree is also small (~0.02%). However, the average difference in volume computed (631 l) is still the value one expects from just considering maximum interception capacity: the average projected area of an average tree amounts to 439.5 l of intercepted water for each tree (439.5 l · 611 trees = 268,535 l for all 611 trees). This is an interception capacity yields up to 10 mm."
Provided by @altbot, generated privately and locally using Ovis2-8B
🌱 Energy used: 0.599 Wh