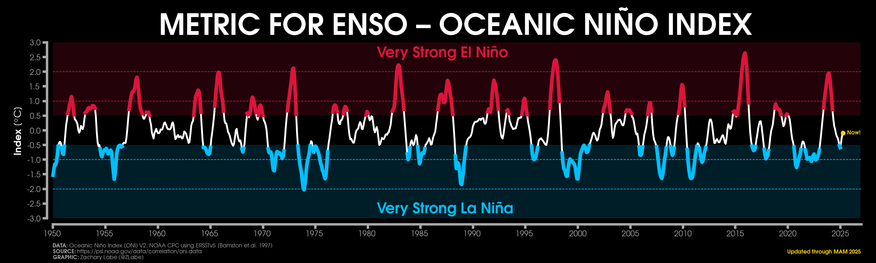
I've added a new graphic to my climate indicators page, which shows the Oceanic Niño Index (ONI) used for monitoring El Niño/La Niña conditions. I will update it each month at https://zacklabe.com/climate-change-indicators/.
This graphic was created thanks to a follower request. Feel free to provide visualization suggestions any time!