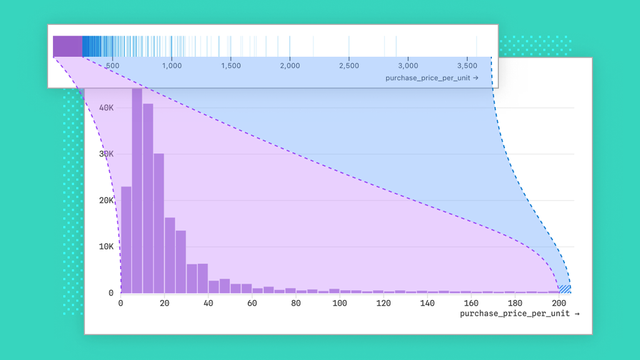
Histograms are useful, easy to interpret, and among the most common chart types for business intelligence. But building histograms that work well out of the box — no matter the data — is trickier than it sounds. We share some of the challenges faced, and decisions made, when designing histograms for Observable Canvases: https://observablehq.com/blog/designing-better-histograms