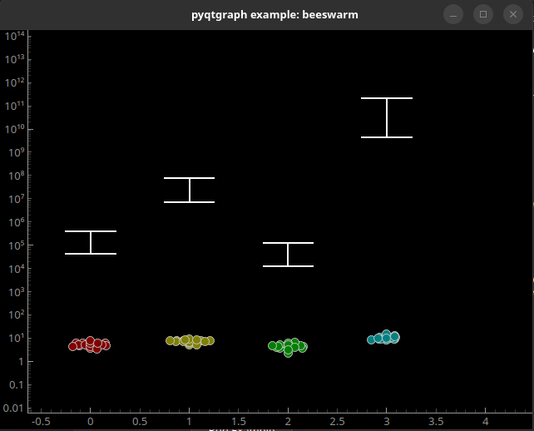
I've just discovered pyqtgraph and I'm just flabbergasted at what's possible as a lowly matplotlib user.

Some of those example plots and the way you can interact with them are so awesome. If you're making py apps for data acquisition/analysis I highly recommend checking it out.

https://pyqtgraph.readthedocs.io/en/latest/getting_started/introduction.html#examples

#python #pyside6 #pyqt

Introduction — pyqtgraph 0.14.0dev0 documentation

@glob_god PyQtGraph maintainer here (the pyqt tag caught my attention). I'm so glad you're finding it useful! We'll never be as feature complete as matplotlib, but the interactivity is really tough to beat! Feel free to ask questions (I'm hoping to do another release in the coming week or so).

@ogi oh damn that's so cool that you saw this!

I have a few side projects going for my PhD that involve analysing hyperspectral data and interacting with vertical farm lighting settings that I'll be absolutely implementing PyQtGraph in.

@glob_god FWIW the next release is having some major performance improvements on 3D plots (one of the regular contributors took it upon himself to learn some OpenGL and made the library much better for it).

#PyQtGraph definitely seems to have a niche in the experimental science/engineering fields for sure.

How did you come across the library to begin with?

@ogi That's excellent for me as hyperspectral images are 3D, we call them hypercubes. Keen to discover what's possible.

Honestly I just googled "pyside6 interactive graph", saw 'PythonGUIs' article and went to the docs from there.

@glob_god the docs could use lots of work, if you're brand new to the library, I highly recommend starting out w/ the examples app (python -m pyqtgraph.examples) ..that's been the way most newcomers come up to speed (myself included).

I should point out that historically, the 3D plotting capability has not gotten the attention/support that the 2D stuff has (primarily due to a lack of opengl knowledge among current maintainers/contributors).

@ogi I'm currently enjoying reading the docs and looking through the examples! Very happy to have such a good spread of examples for sure.

Something I may note, while messing around with the example plots, specifically X and y transformations on the beeswarm plot: The log(y) transformations appear to not transform the y scatters but instead transform the boxplots(/ranges?) to a scale I don't understand rn.

@glob_god log rescaling is super buggy... best way I can describe it is it has a ~80% implementation, but there are edge cases where it falls apart or you really have to tinker w/ order of operations on adding data to a plot and setting log mode to get the result you want.

The reasons are largely that Qt's GraphicsView framework doesn't have support for non-linear transformations so instead of being able to depend on QTransform objects to zoom/pan the view, we're having to do a lot ourselves within the library.

Of course, if you can identify some fixes, a PR is welcome (please don't submit one massive PR fixing "all" the issues haha).

@ogi Don't worry, you wont see me submitting a massive PR bc you wont see one at all :') but the vote of confidence is appreciated haha