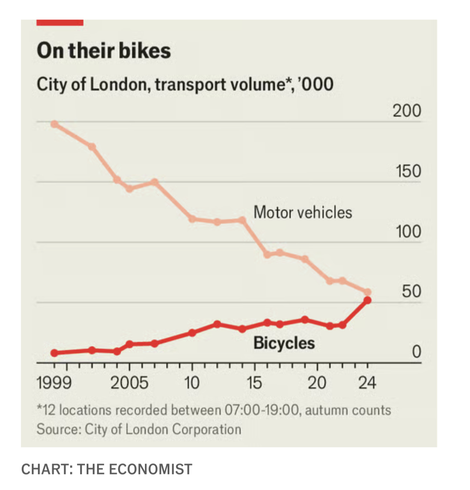
some good news - in the centre of London, cyclists are on track to outnumber motor vehicles (cars, buses, lorries) within a couple of years

anecdotally it has got a much more pleasant place to walk around in the last decade

https://www.economist.com/britain/2025/05/22/london-has-become-a-cycling-city (£)

@bovine3dom in Paris bicycle use now exceeds car use. Paris mayor Anne Hidalgo wants to turn the French capital in a green metropolis
https://english.elpais.com/lifestyle/2024-04-24/the-cycling-revolution-in-paris-continues-bicycle-use-now-exceeds-car-use.html
The cycling revolution in Paris continues: Bicycle use now exceeds car use

A study indicates that 11.2% of trips in the French capital are made on two wheels, compared to 4.3% in four-wheel vehicles

EL PAÍS English
@jofr yeah, Paris has improved so much in the last decade. I made a map a while ago of car-free households there https://o.blanthorn.com/france-iris/map/#x=2.34&y=48.86&z=12.23 and you can see that the richer west of the city is dragging its heels a bit
French IRIS tiles

@bovine3dom nice choropleth map! How did you do it? Leaflet or Plotly?

@jofr thanks :)

https://github.com/bovine3dom/france-iris it's tippecanoe + deck.gl + maplibre (+ perspective if you click the graph icon in the top left to mess with the data)

deck.gl is generally more performant than leaflet but the main reason I'm using it here is that you can use CSS layer mixing to make the base map punch through the colours because it renders as a separate layer on top of the map

GitHub - bovine3dom/france-iris: deck.gl vis of France's INSEE census tiles

deck.gl vis of France's INSEE census tiles. Contribute to bovine3dom/france-iris development by creating an account on GitHub.

GitHub