Today, Thursday, Germany will get 99% of its power from solar and wind.
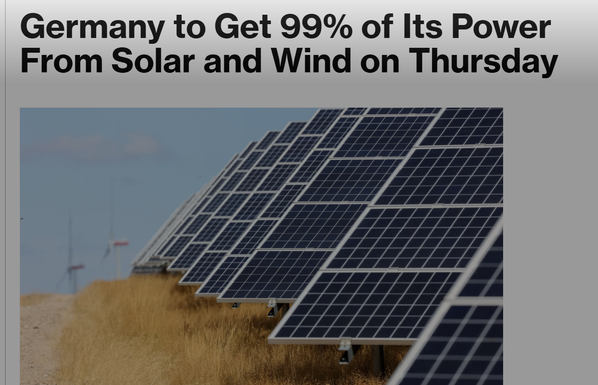
Today, Thursday, Germany will get 99% of its power from solar and wind.
@wa_schaly If you want to check the electricity production and carbon emissions in your country (Europe mainly) check the link 👇
The one in use is for Germany
https://app.electricitymaps.com/zone/DE/72h/hourly/2025-05-01T10:00:00.000Z
@wa_schaly @Climatehistories Gefunden unter FAQs auf der ursprünglich verlinkten Webseite. Bzgl. Quellen:
https://ww2.electricitymaps.com/methodology#data-sources
Ich habe weiter durchgeklickt und zu Solar/Australien wird hierauf verwiesen: