Worked (a bit) on my Ontario solar analysis (ICYMI: https://wlach.github.io/gtha-electrification/) while on a train today.

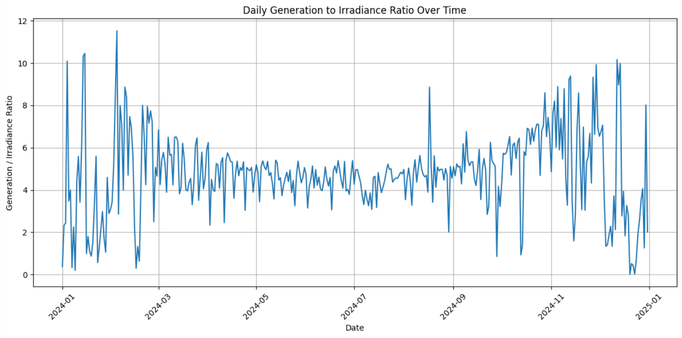
Latest exploration is irradiance vs. production. Turns out NASA has pretty great irradiance data for the entire world, which you can freely download. Totally possible to plot that against inverter production to get a nice graph of the ratio.

Results are interesting and not what I initially expected (as a curious bystander with no real expertise in solar production).

Some Notes on Electrification and Solar in Ontario, Canada

The ratio is pretty consistent in the summer months. You seem to get more energy per unit of irradiance in the shoulder months (fall/spring). Results vary wildly in winter (probably due to snow cover).

Will try to polish this up and put it into the report later.

Ok polished it up and put it on the dashboard too, at least in the energy part:

https://wlach.github.io/gtha-electrification/energy/#solar-irradiance

tl;dr: subsequent solar years for me are probably going to be a lot like 2024 unless I'm missing something.

Evidence