Still in awe of #chatgpt #o1 's ability to create bigger pieces of code.

Wanted to build a fairly tricky feature for that diary app I'm coding for fun in my spare time:

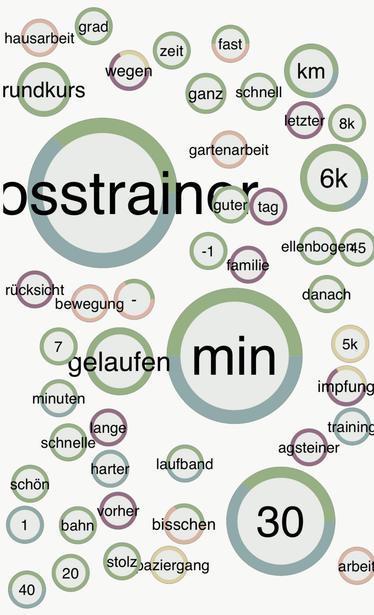
collect all words in all diary entries, remove stop words like "and", and create a bubble diagram where the size of a bubble reflects the word frequency, and the bubble has a 20% thick border reflecting the mood (1-5) that the user entered with this diary entry, where the circle segment sizes correspond to the frequency of that mood.

It took me 3 long promps to get this javascript code out of o1:

1. write a python program to get a list of all stop words.
2. do the data collection and a basic bubble diagram
3. do the 5-color circle segment border

All 3 times o1 produced flawlessly working code, at first attempt.

Doing this by hand would have taken me many hours (alone those circle segments reflecting the frequency of how often a user choose mood 1, 2, 3,...)

The pic shows the result with the bubbles about my sports entries of the last 3 months.

@karlheinz_agsteiner cool! I would be really interested to see that prompt or similar ones 🤗

@Andiairlines okay you wanted it :-). That's two prompts, one for drawing the circles and the words, one for painting the circles based on mood frequency associated with the word. (I'll leave out the prompt to generate german stopwords, which is fairly simple).

First prompt:
<lenghty list of all available javascript classes and their methods>

<source code of the class this should go into>

**YOUR TASK**
We want to create a new view does the following:
1. finds all words in all entries of a given time range, ignoring stop words. The file "german_stopwords.txt" contains the stop words.
The result of this step is a dictionary with words as keys and (frequency, [mood 0 count, mood 1 count, ...]) as values.
Example: I find the word "Katze" in an entry with mood 1. Then the result is {"Katze": (1, [0, 1, 0, 0, 0, 0])}. If I find the word "Katze" again, in an entry with mood 2, then entry is updated to {"Katze": (2, [0, 1, 1, 0, 0, 0])}.

2. Create a list of the words in the dictionary, sorted by frequency - most frequent first.

3. create a new view with a canvas element that has a width of 1000px and a height of 1000px.

4. starting with the most frequent word, repeat the following steps:

4.1. pick a random location on the canvas to hold a rectangle of size 50x50px.

4.2. store the rectangle position and size in a list "drawnRectangles"

4.3. draw a circle of size 50x50px at the rectangle position.

4.4. draw the text of the word at the center of the circle.

4.5. repeat 4.1-4.4 for the next most frequent word, changing the circle size to reflect the smaller frequency compared to the first word. Try 10 times to find a place where the circle does not overlap with an existing rectangle.

4.6. repeat 4.1-4.4 until all words are drawn, or you have tried 10 times to find a place for the word without overlap.

Then integrate this function in a simple way into this section of index.html, e.g. by adding a button that shows the view:

<code where to integrate it>

@karlheinz_agsteiner

2. **User Story**
- *Best for aligning code with user needs* → Requires additional technical clarification for full code gen.

3. **Example-Driven**
- *Best for replicating visual/behavioral patterns* → Great for UI code if reference examples are provided.

4. **Goal-Oriented** ("Outcome First")
- *Best for high-level architecture* → Leaves gaps in low-level implementation details.

Tbc