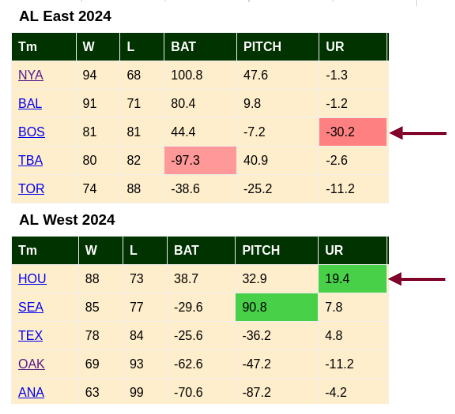
Unearned runs above average is:

UR=Total_Runs - Earned_Runs

UR(League_Total)/30 - UR(Team_Total)

A team with negative UR is below average, positive above average.

Attached shows Boston with the worst UR in 2024 cancelling out their above average BAT making them a 0.500 team. Houston had second best UR in the league helping them win AL West.

#mlb

Attached is a graph showing % of all runs that were due to fielding errors from 1963-2023. As baseball parks got better errors have fallen along with this percentage. Today URs hover around 1/12 of all runs.

League average runs scored/game hovers around ~4.5 in modern baseball. Thus, unearned runs per game would average ~.36, a little more than half that for the first 5 innings.

Although URs don't count against any player, they count equally with ERs when determining who wins a game.

A variance above or below league average is called a tier in this data model. Variances are rounded up or down to the nearest integer and capped at +4 and -4. In this graph we count the number of unearned runs in the first 5 innings of each UR tier from -4 to +4.

The attached graph shows a choppy line which is a problem. Since UR is a seasonal stat, the variance does not reflect the actual players playing like lineup and starter tiers do.

The over/under run simulator must count URs somehow.