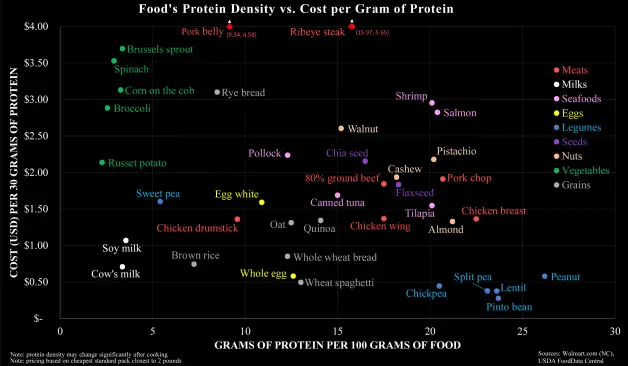
Cost by Protein Source
https://lemmy.ca/post/23261587
I want this chart, but add the third Z axis of “environmental cost” whether it be just CO2 emissions or a “total” impact score.
I imagine those legumes get even stronger, while the meats lose ranking.
This chart shows the liters of water required to produce one kilogram of certain basic food products.