Cost by Protein Source
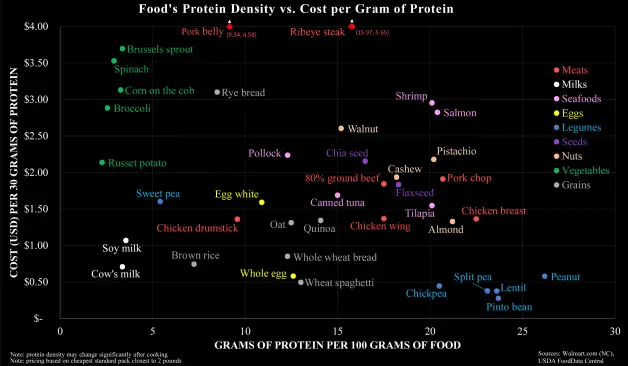
Cost by Protein Source
I want this chart, but add the third Z axis of “environmental cost” whether it be just CO2 emissions or a “total” impact score.
I imagine those legumes get even stronger, while the meats lose ranking.
why does cottonseed, which would otherwise go to waste, get counted against cattle, when that is a conservative of resources?

