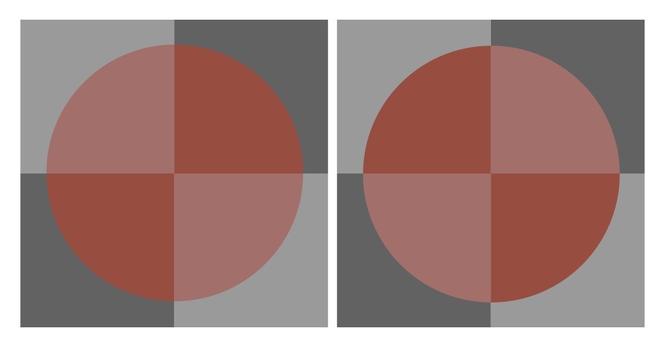
This still is 🤯 to me with respect to the “fingerprint” of spatiotemporal articulations and how we create information.

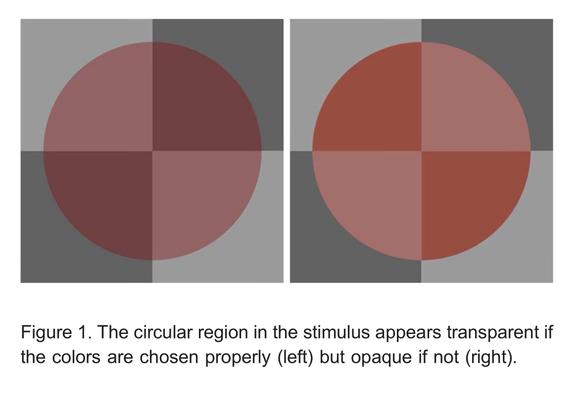
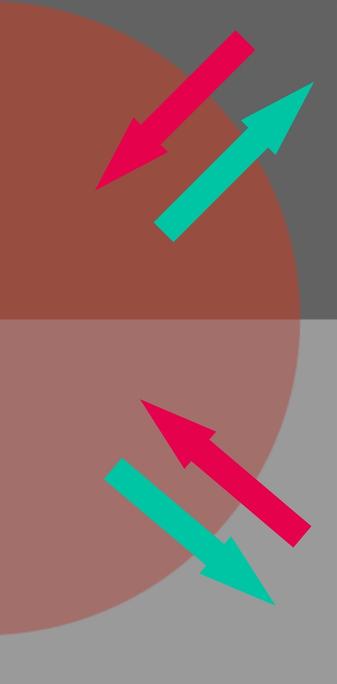
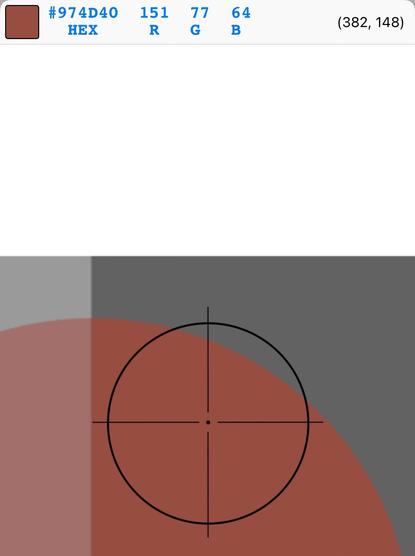
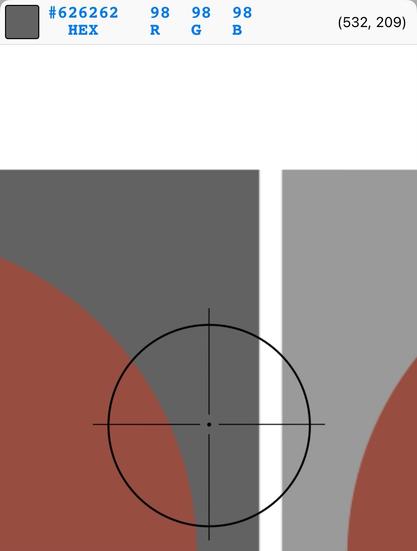
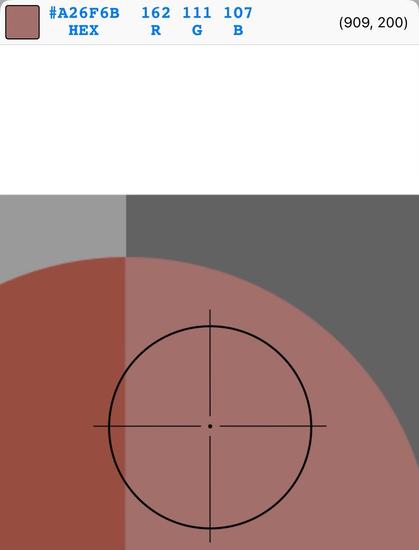
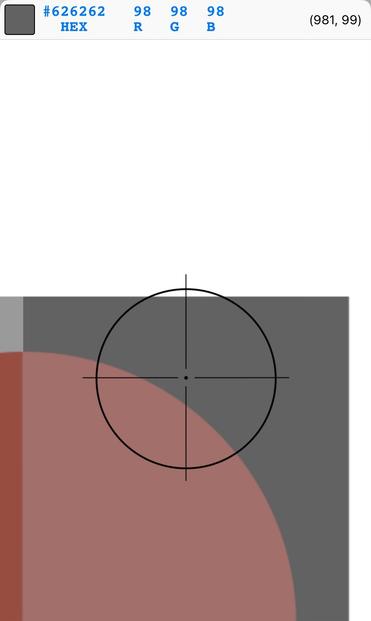
This is my riff on Ekroll and Faul’s work from 2011. Here, I chose to make the tristimuli **identical** in both depictions, with the sole difference is that the “disc”is rotated 90°.

The nature of the polarity along luminance vs chrominance triggers a strong probability of “transparency mode” in the first, while very low in the second.

The original had varying tristimuli, which in my opinion degrades the superimportance of the spatiotemporal articulation.

This demonstration is absolutely crucial to keep at the front of our lens when we hear the rabble discussing nonsense like “gamut mapping”.

There’s a 10000 thread at GitHub on CSS gamut mapping that is going to screw generations of web developers. https://www.w3.org/TR/css-color-4/#css-gamut-mapping

Folks really need to slow down and think more.

Never mistake motion for action.

CSS Color Module Level 4

So what all of these lines of thought succumb to is the brain wormed idea that “colour is stimuli”. We all know this is false, as the Ekroll and Faul demonstration shows with incredible persuasiveness.

So what **can** we learn from Ekroll and Faul? Is there a deeper pattern here?

I believe there is.

First would be to identify a key factor in the Ekroll and Faul demonstration. In my revision, given that the tristimuli are identical, we can get a sense that the local mean energy will be the +

- sole difference between the articulations. That is, we can expect the neurophysiological inhibitory opponent signals to be of similar gradient maxima and minima.

The key point is the polarity of the signal. What do we mean by “polarity”? This is the idea that there appears to be sizable indications that the information inference computations are grounded strongly by the energy “directions”.

Here, the arrows loosely identify the neurophysiological gradients of our biological assemblies.

If we ignore the nonlinear encoding OETF of the RGB, we can see rather clearly that in terms of the upper right quadrant, there is a unique energy progression. If we consider going from the disc to the ground, note the *minima* of the RGB. Why might RGB be useful for analysis? Because it is quite literally a normalized wattage.

All of this is rather interesting if we step back and fully appreciate that in terms of the neurophysiological signals, we are quite literally “hard wired” with energy analysis assemblies. The decrement signals could be broadly considered to be “energy down” gradient signals, and the increment signals are “energy up”.

If we compare to the low probability transparency mode upper right quadrant, we can see that the minima of the RGB uniquely “points” in a different direction.

I believe it is informative to think about the polarity gradient in terms of an “energy window”. That is, we can get a sense that the “energy floor” **could** be an important qualifier of the heuristic. In the “transparency mode” of the left side, the “form” of the “disc” has a *lower* energy floor on all four of the “wedges”. In the right form, the wedges *vary* in energy polarity. The upper right wedge is an increment to ground, and vice versa for the lower right.

So how might this related to pictorial depictions that matter more to image authors?

Let’s consider pictorial exposure depictions. Think about what we mentally imagine when we say “increase exposure”. There is a very unique mechanic that few stop to evaluate. Here is a simulated exposure sweep from @barselino, derived from a negative and processed under a custom chain.

This sort of a localised test strip picture is *incredibly* informative if we think about the “energy floor”.

For starters, it is not unreasonable to think of pictorial exposure as “layers of mist” or “layers of tissue” being “stacked” on the pictorial depiction. The key takeaway? The visual cognitive computation of “transparency” is *absolutely key* in our analysis.

And again, think about the “energy floor” as we progress left to right. Remember, RGB, after we remove the encoding transfer characteristic, is *normalized wattage*.

@troy_s Did you mean energy floor as in "the lowest value in the picture is at least XXX" (in painting we think like that anyway)
@chengdulittlea 100% in terms of the RGB triplets. The min(RGB) floor is the energy floor. The max(RGB) is the ceiling.
@troy_s Oh ok. Good to know yeah.