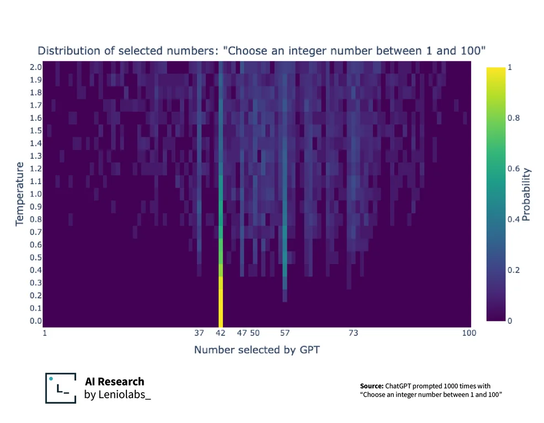
Ask ChatGPT to pick a number between 1 and 100 - which does it pick? (by Leniolabs)
@infobeautiful wtf is temperature? Why isn’t this a histogram? Do I need a more recent math class?
@elset @infobeautiful That was my immediate question, too. This chart clearly has a whole dimension I'm missing!
@johnpettigrew @elset @infobeautiful it's a parameter on the trail end of the model. After it decides on a distribution for the probability of the next output, it still has to choose which word/token/number to actually spit out. Temperature squishes the distribution so it's less likely to simply pick the most likely, giving it some extra randomness.
@postitman @elset @infobeautiful OK, so what does that mean for the chart? If this was a histogram, we'd see the peaks matching the most-used numbers, which is what the text is all about. What does the temperature tell us?
@johnpettigrew @elset @infobeautiful temperature is artificial randomness after the model does most of the fancy stuff, this heatmap shows that the biases don't really go away even with this randomness turned to max... The peak at 42 is discernable almost no matter the temperature.

@johnpettigrew @elset @infobeautiful interestingly, even if this added randomness is high, there's still a broad bias away from the edges...

Ultimately you could get all that across with a few histograms, but I do like how concise heatmaps make this