With SwiftUI Charts, does anyone know how to have a gradient filll below the line when the Y axis data is both negative and positive?
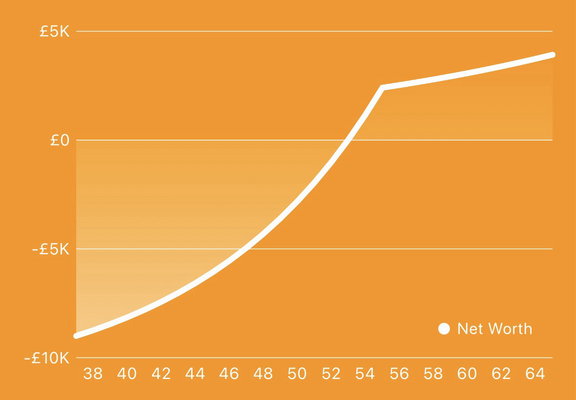
I’m using AreaMark, in the first example where all the values are > 0 this works great but in the second example where the values start from < 0, the AreaMark always wants to fill from 0 to the line.